Looking for an EWMA Chart Template in Excel?
QI Macros has a ready made EWMA template for you!
Why use an EWMA (Exponentially Weighted Moving Average) chart?
Use EWMA Charts when you want to detect small shifts in performance.
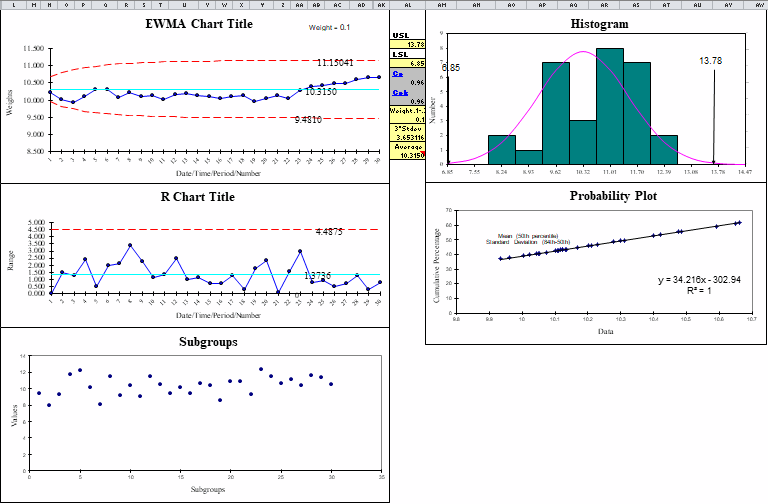
Example of the EWMA template in QI Macros add-in
The template contains up to 10 columns to input data observations:
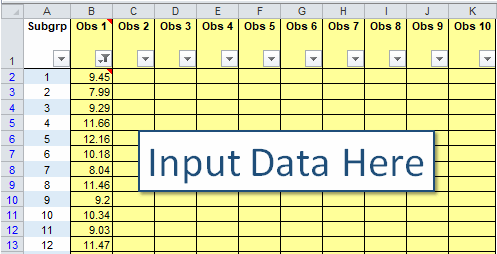
As you input data, the charts will automatically populate to the right.
EWMA metrics in column AL can be customized
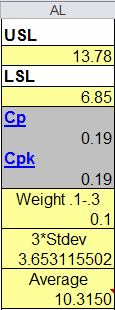
The EWMA template uses .1 as the default weight but this value can be customized.
The template calculates the remaining values based on the data, however the formulas can be replaced with different values if you have them:
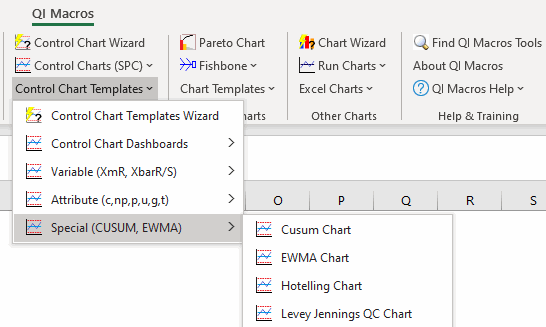
Find the EWMA Chart template by clicking on the QI Macros menu > Control Chart Templates > Special (CUSUM, EWMA) > EWMA Chart:
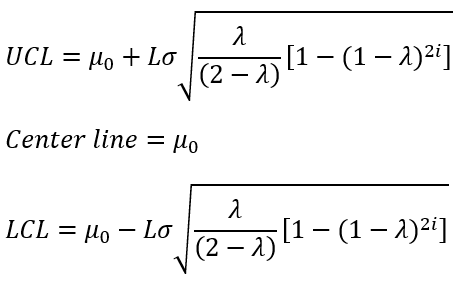
EWMA Chart Formula
Stop Struggling with EWMA Charts!
Start creating your EWMA Charts in just minutes.
Download a free 30-day trial. Get EWMA Charts now!
QI Macros Draws These Charts Too!
