Need a Levey Jennings Template in Excel?
QI Macros has a Ready-Made Levey Jennings Template for You!
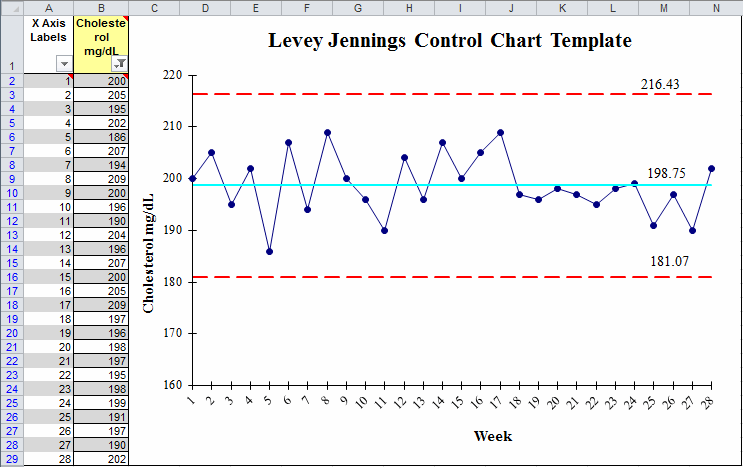
Healthcare labs use the Levey Jennings charts to monitor key measures of health like cholesterol and glucose.
Example of a QI Macros Levey Jennings Control Chart Template

The template opens to the standard Levey Jennings chart. However, there are several other template options including percent, target and fixed standard deviation charts:
![]()
Here is how each Levey Jennings Control Chart Template works
| Chart | Center Line | Sigma Lines | Input Area |
| Levey Jennings 1-Chg | Calculated from the data | Calculated from the data and drawn at 1, 2 and 3 standard deviations |
 |
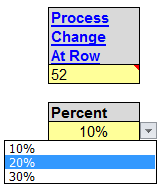
| Levey Jennings Percent | Calculated from the data | Default draws sigma lines at 10, 20, and 30% from the center line. Percentages can be changed using the drop down menu. |
 |
| Levey Jennings Target | Calculated from the data but can be overridden by inputting a different value in the Target cell |
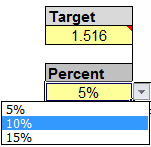
Default draws sigma lines at 5, 10 and 15% from the center line. Percentages can be changed using the drop down menu. |
 |
| Levey Jennings Fixed Stdev | Calculated from the data but can be overridden by inputting a different value in the Center Line cell |
Calculated from the data but can be overridden by inputting a different value in the Stdev cell |
 |
Note: According to SOFT / AAFS FORENSIC TOXICOLOGY LABORATORY GUIDELINES 9.1.12, standard deviation may represent an unacceptably large percentage deviation from the mean. Therefore, a realistic percentage deviation should be used, such as ±20% or ±30%. This option is available in the Levey Jennings Percent template and the Percent Macro.
To Find Levey Jennings Templates in QI Macros for Excel:
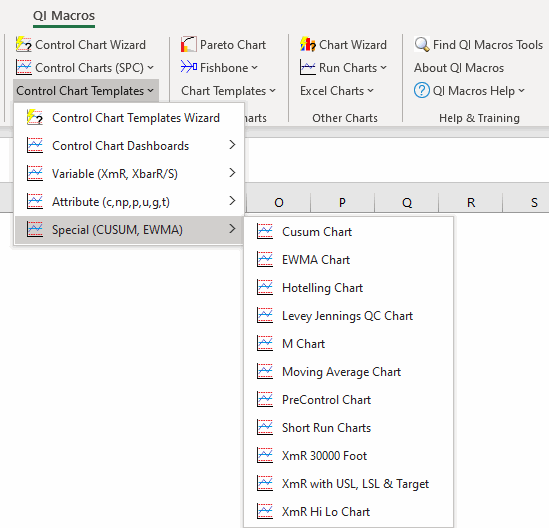
Click on the QI Macros menu > Control Chart Templates > Special (CUSUM, EWMA) > Levey Jennings Stdev or Levey Jennings 10%:

Stop Struggling with Levey Jennings Charts!
Start creating your Levey Jennings Charts in just minutes.
Download a free 30-day trial. Get Levey Jennings Charts now!
QI Macros Draws These Charts Too!

