Need to draw an XmR Hi-Lo Chart in Excel?
QI Macros has a Ready Made XmR Hi-Lo Chart Template!
Example of QI Macros XmR Hi-Lo Chart template in Excel.
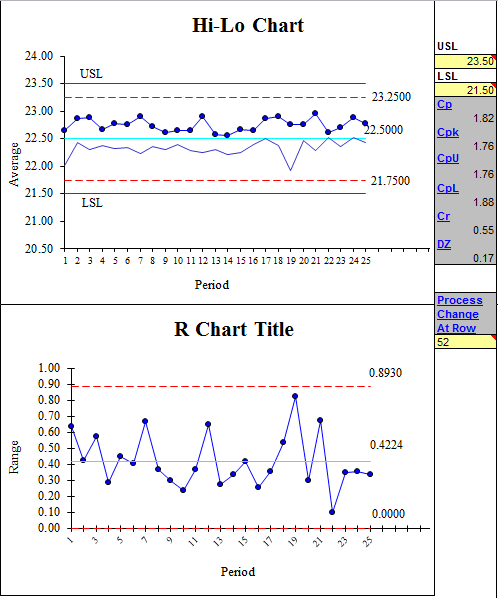
Spec Limits on a Hi-Lo chart are provided by the user and entered manually in Cells AP2 and AP4.
Control Limits on a Hi-Lo chart are based on the Spec Limits.

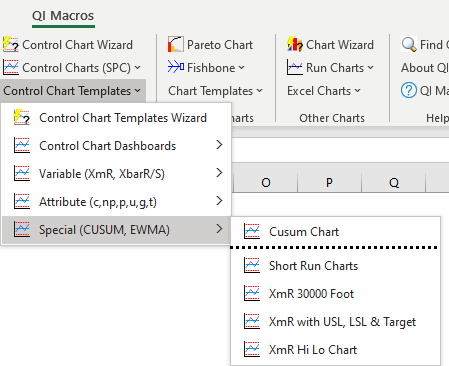
To open this template, select the Control Chart Templates drop-down menu > Special > XmR Hi Lo Chart:
Stop Struggling with Control Charts!
Start creating your Control Charts in just minutes.
Download a free 30-day trial. Get Control Charts now!
QI Macros Draws These Charts Too!
