Struggling to Create a g Chart in Excel?
QI Macros can draw g charts for you in seconds!
Draw a g Chart using QI Macros:
- Select your data.
- Click on QI Macros menu > Control Charts (SPC) > Attribute> g.
- QI Macros will do the math and draw the graph for you.
Why it Matters:
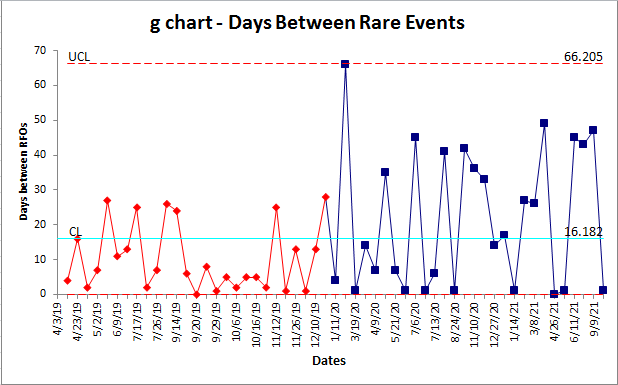
Use g Charts to analyze the time or units BETWEEN rare events. For example, a hospital might track never events such as retained foreign objects during surgery. They could measure days between events or surgeries between events.
Example of QI Macros g chart

Learn More...
Stop Struggling with g Charts!
Start creating your g Charts in just minutes.
Download a free 30-day trial. Get g Charts now!
QI Macros Draws These Charts Too!

