g Chart Formulas
QI Macros Can Calculate Them For You!
Draw a g Chart using QI Macros
- Select your data.
- Select g chart on QI Macros menu.
- QI Macros will do the math and draw the graph for you.
Go Deeper:
g Charts evaluate process stability when tracking rare events like:
- surgeries between infections
- ICU Admissions between Infections
- ADE Doses Administered Between ADEs
g Chart Formula
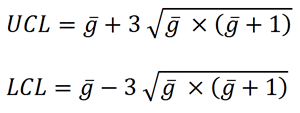
Center Line = 0.693*gbar
g = time or units between rare occurrences
NOTE: It is not possible to have negative limits on a g Chart. With that, any calculated value that is below 0 is automatically changed to 0.
Stop Struggling with g Charts!
Start creating your g Charts in just minutes.
Download a free 30-day trial. Get g Charts now!
Learn More...
The g chart is just one of the tools included in QI Macros SPC Software for Excel.
Why Choose QI Macros Over Other Control Chart Software?
![]()
Faster to Learn
and Easier to Use
- Works right in Excel
- Create charts in seconds
- Easy to customize & share charts
- Free Training Anytime
![]()
Proven and Trusted
- More than 100,000 users
- In More than 80 countries
- Five Star CNET Rating - Virus free
![]()
Affordable
- Only $379 USD
Quantity Discounts Available - No annual subscription fees
- Free technical support
