Looking for a t Chart Template for Excel?
QI Macros has a ready made t chart template for you.
Use t charts to Monitor the Time Between Rare Events
Example of a t chart template in QI Macros for Excel.
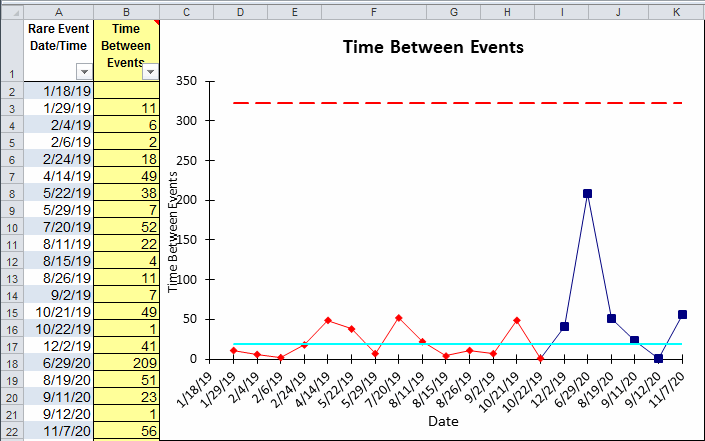
Just input the date and time each event occurred in column A and the template will calculate the time between events in column B and chart them to the right. It's that easy!
Stop Struggling with t Charts!
Start creating your t Charts in just minutes.
Download a free 30-day trial. Get t Charts now!
QI Macros Draws These Charts Too!
