Want to Define Control Limits for your XmR Chart?
QI Macros XmR Target Template is What You Need.
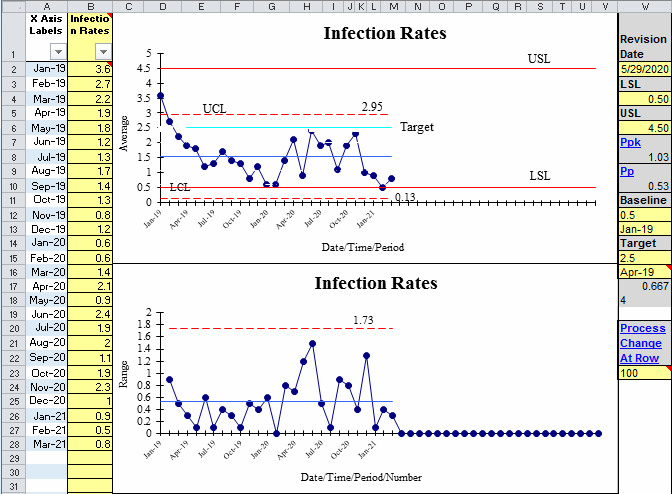
The centerline and control limits on a control chart are usually calculated from the data. However, in some instances you may want to evaluate a set of data against a baseline set of limits. The XmR Target template allows you to do this!
QI Macros XmR Target Template Example
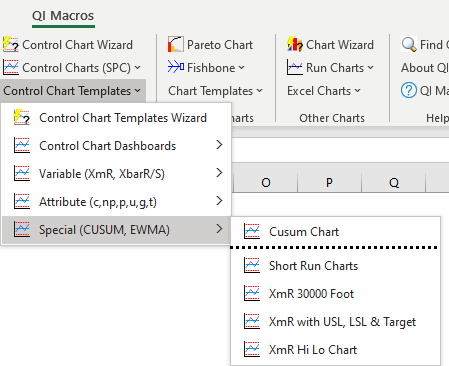
To open this template, click on the QI Macros menu, Control Chart Templates, Special > XmR with USL, LSL & Target.
Input your Dates, Data, Target, USL and LSL in the Designated Cells
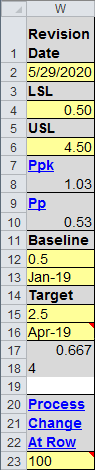
Input USL and LSL as shown in W4 and W6.
Input a Baseline value in W12.
Input a Target Value in W15 and what label to start showing the target.
You can also specify a process change in W23.
NOTE: To show only points with data on your chart, click the arrow in cell B1 - select or deselect "Blanks" option.
Stop Struggling with Control Charts!
Start creating your Control Charts in just minutes.
Download a free 30-day trial. Get Control Charts now!
QI Macros Draws These Charts Too!
