Trying to Create Levey Jennings 10-20-30% Charts in Excel?
QI Macros can create them for you!
Draw a Levey Jennings Percent Chart using QI Macros
- Select your data.
- Click on QI Macros menu > Control Charts (SPC) > Special > Levey Jennings % .
- QI Macros will do the math and draw the graph for you.
Listen to our Levey Jennings podcast below!
* Generated using QI Macros' source material via an AI model *
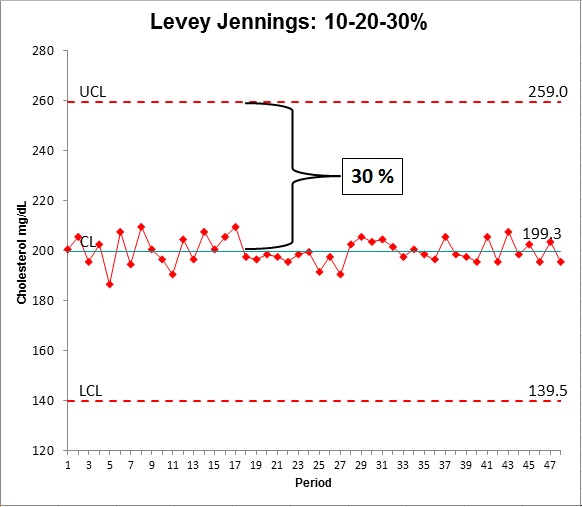
The Levey Jennings Percent chart uses 10% of the Average to Calculate Control Limits
Healthcare labs use the Levey Jennings Charts to monitor key measures of health like cholesterol and glucose. The Levey Jennings Chart, unlike other SPC charts, has an option to use 10 percent of the average as a way of calculating control limits:
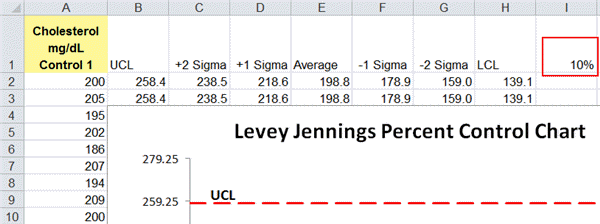
How to Change the Percentage Used
Once the chart is created, you can click on the data sheet created when the macro was run and change the percentage (in cell I1) to 5% or whatever you desire:
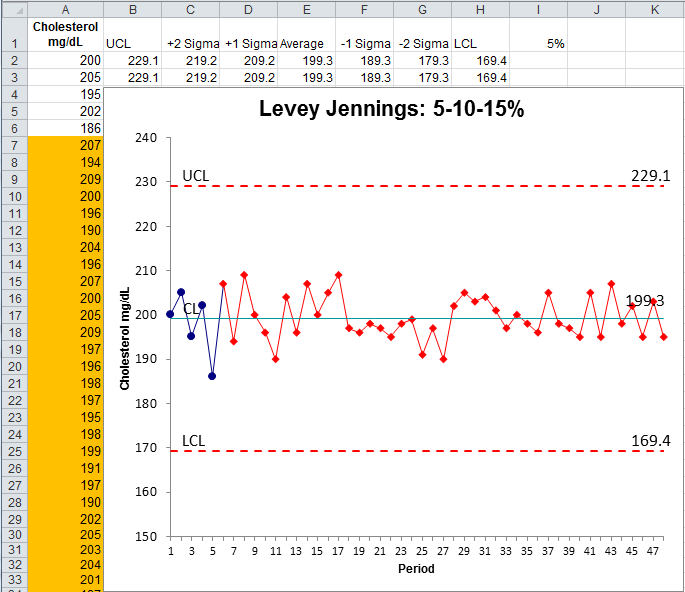
QI Macros will update the chart with new control limits. Note: Use the QI Macros chart menu to re-rerun stability analysis with the new limits. You may also want to adjust the scale of the y-axis:
According to SOFT / AAFS FORENSIC TOXICOLOGY LABORATORY GUIDELINES 9.1.12, standard deviation may represent an unacceptably large percentage deviation from the mean. Therefore, a realistic percentage deviation should be used, such as ±20% or ±30%.
Stop Struggling with Levey Jennings % Charts!
Start creating your Levey Jennings % Charts in just minutes.
Download a free 30-day trial. Get Levey Jennings % Charts now!
QI Macros Draws These Charts Too!
