Updating Existing Control Charts can be Cumbersome
That's why QI Macros has automated the most common control chart tasks.
You'll save time and mistake proof your updates.
Once you create a control chart or other chart using QI Macros, you can easily update it using the QI Macros Chart Tools menu. To access the menu, you must be on a chart or on a chart embedded in a worksheet.
QI Macros Chart Menu is divided into three sections
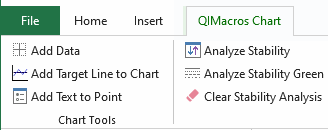
Chart Tools
Control Chart Tools
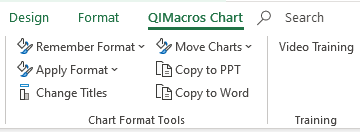
Chart Format Tools
Chart Tools for Use with Most QI Macros Charts

Control Chart Tools
Options to give you maximum flexibility to customize control charts with just a few clicks of a mouse:

Re-run stability analysis after changing data or control limit calculations:
- Analyze Stability - reruns stability analysis with current data and control limit settings
- Analyze Stability Green Up or Green down - reruns stability analysis but will turn positive trends green instead of red to indicate the change is desirable.
- Clear Stability Analysis - turns off stability analysis or clears it if you want to start over.
- Show/Hide Rule Numbers - shows the specific stability analysis rules that caused a point or trend to be highlighted in red as unstable.
Change which control limit lines are displayed and how they are formatted
Change the data points used to calculate control limits:
- Show Process Change (i.e., stair step limits)
- Fix Control Limits - fix control chart limits at a certain point
- Recalculate UCL/LCL - recalculate control limits after adding new data
- Ghost a Point - leave data point on a chart but remove it from control limit calculations
- Delete a Point - remove a point from the chart and from control limit calculations
Miscellaneous Chart Menu Option
- Add Text to Point - to provide further explanation about your data
- Select Data for Point - locate any data point within your Excel spreadsheet
- Add UCL-CL-LCL Data Labels to Point - Labels added to each Control Limit
Chart Format Tools

Remember and Apply Chart Formats: a huge time saver for those who like to customize various chart elements!
- Customize one chart with the fonts, styles, colors, etc. you want.
- Click Remember Format.
- Create another chart and click Apply Format to make the same changes on the second chart.
- Click Apply To All if your worksheet (not workbook) has more than one chart on it.
Change Titles: Simplifies updating chart titles by providing prompt boxes for X axis, Y axis and chart title.
Move Charts
- Use Move Charts to export all embedded charts on a worksheet to their own worksheets.
- Use Move All Charts to export all embedded charts in a workbook to their own chart sheet.
Copy charts to PowerPoint and Word
Stop Struggling with Control Charts!
Start creating your Control Charts in just minutes.
Download a free 30-day trial. Get Control Charts now!
QI Macros Draws These Charts Too!


