Want to Create Control Charts with Fixed Control Limits?
QI Macros can create them for you right in Excel!
Draw a Fixed Limit Control Chart using QI Macros:
- Select your data.
- Click on QI Macros menu > Control Charts (SPC) > Special> Fixed Limit.
- QI Macros will do the math and draw the graph for you.
Why Use a Fixed Limit control chart?
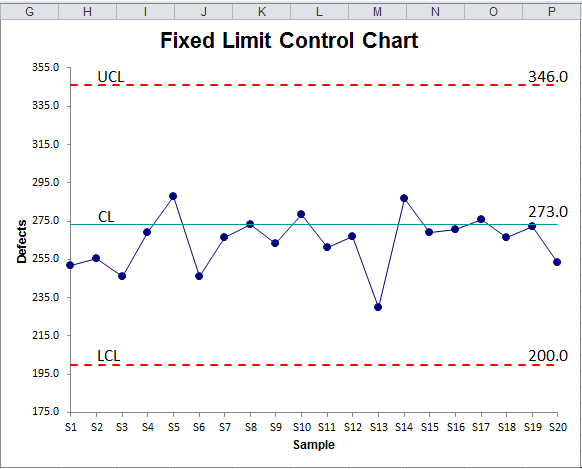
Example of a QI Macros Fixed Limit Control Chart

To create a Fixed Limit control chart using QI Macros add-in:
- Select your data
- Click on QI Macros menu and select Control Charts » Fixed Limit.
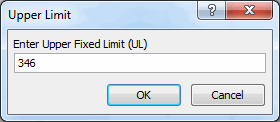
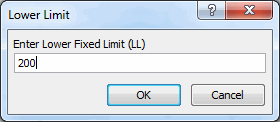
- QI Macros will prompt you to enter the fixed Upper Limit (UL) and Lower Limit (LL):


The Center Line (CL) of the control chart will be calculated as the midway point between the two. If the Lower Limit is zero, you will be asked to enter the Center Line as well.
QI Macros also contains ready made fixed limit templates for each control chart.
Stop Struggling with Fixed Limits Charts!
Start creating your Fixed Limits Charts in just minutes.
Download a free 30-day trial. Get Fixed Limits Charts now!
QI Macros Draws These Charts Too!

