Trying to Create a ZmR Control Chart in Excel?
QI Macros can create a ZmR chart for you in seconds!
Use an ZmR Chart to:
- Evaluate the Stability of Short Run Processes (Short Run SPC)
- Show multiple characteristics (e.g., hardness, finish, etc.) on one chart
- Track a part as it goes through the manufacturing process
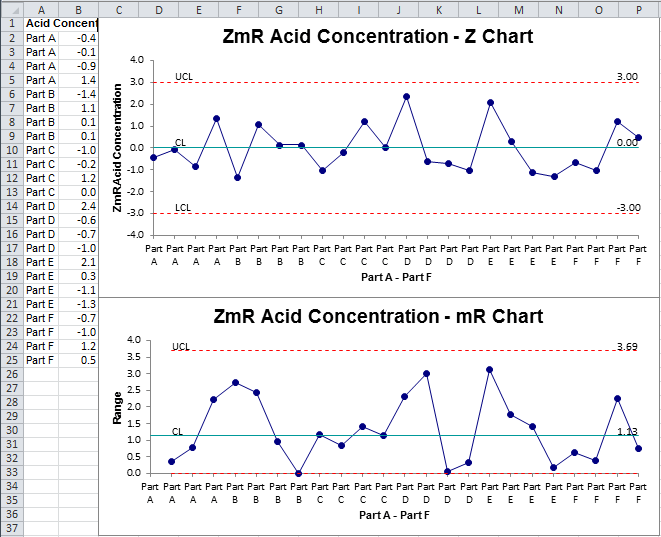
The ZmR Chart does this by converting the X values into a standardized value, Z, using the average (μ) and standard deviation (σ). There are a number of ways to estimate σ. QI Macros uses standard deviation for each part.
Zi = (Xi- μ)/σ
So the UCL = 3, LCL = -3 and CL = 0
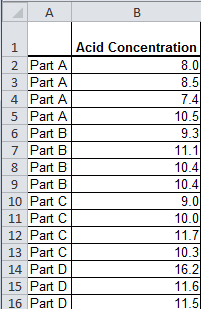
ZmR Chart data usually looks like this:
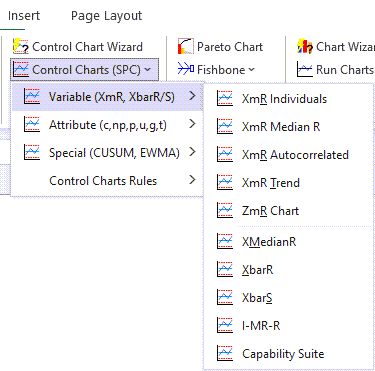
To create a ZmR Chart, highlight your "Product" data (col A), along with the "Value" of the product (col B). Then, click on QI Macros menu > Control Charts (SPC) > Variable > ZmR Chart:
QI Macros does the rest.
NOTE: If you receive the following prompt, "Invalid Data for ZmR," it is because your data is not sorted:
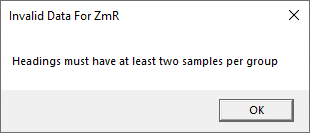
To troubleshoot this matter, make sure to sort your short run data using the "Sort" function with Excel.
Learn more about Short Run Control Charts
Stop Struggling with ZmR Control Charts!
Start creating your ZmR Control Charts in just minutes.
Download a free 30-day trial. Get ZmR Control Charts now!
QI Macros Draws These Charts Too!
