Trying to Create XmR Trend Control Charts in Excel?
QI Macros can create them for you!
Create an XmR Trend Chart using QI Macros:
- Select your data.
- Click on QI Macros menu > Control Charts (SPC) > Variable> XmR Trend.
- QI Macros will do the math and draw the graph for you.
Use an XmR Trend Control Chart to evaluate stability of processes using trended data - costs (e.g., inflation).
XmR Trend Control Chart created using QI Macros for Excel.
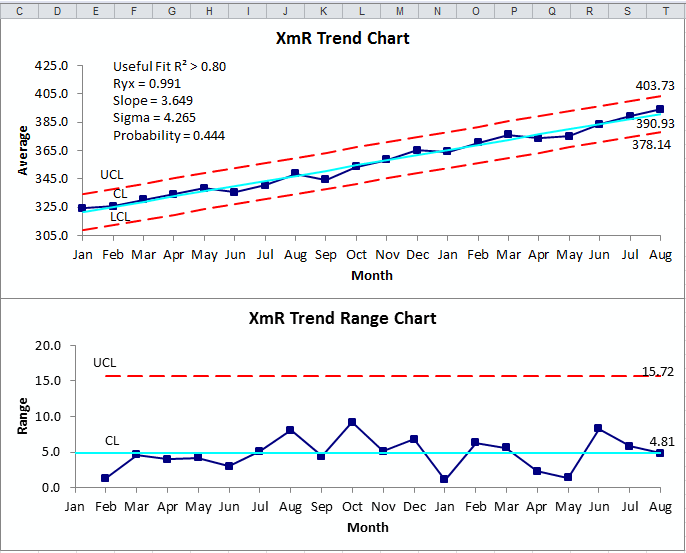
The Chart will calculate the fit of the data to the trend:
Useful Fit R² > 0.80
Ryx = 0.991
Slope = 3.649
Sigma = 4.265
Probability = 0.444
- R² gives the fit of the line to the trend. Greater than 0.80 is a good fit.
- Ryx is the linear correlation coefficient. Compare to probability for df = n - 2.
- Slope is the positive or negative slope of the trend
- Sigma is the estimated standard deviation Rbar/d2
- Probability is critical value for Ryx. If Ryx > Probability then a statistically significant correlation exists.
Stop Struggling with XmR Trend Charts!
Start creating your XmR Trend Charts in just minutes.
Download a free 30-day trial. Get XmR Trend Charts now!
QI Macros Draws These Charts Too!
