Not Sure How to Run Stability Analysis on Control Charts?
QI Macros makes analyzing stability one click easy.
Why it Matters: Stability analysis is a key element of control charts. Make sure your control charts include stability analysis and the ability to re-run analysis when you add new data or process changes.
In QI Macros, the process differs depending on how you create your control chart:
- Control Charts Created with a Macro
- Control Charts Created Using Control Chart Templates
Control Chart Created Using a Macro
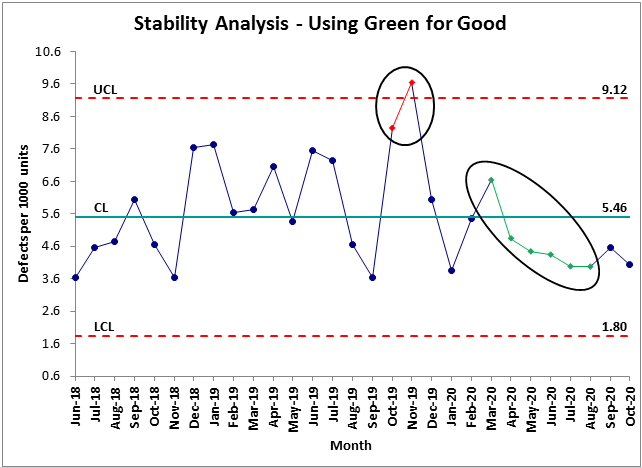
- When you run a chart using a macro from QI Macros menu, QI Macros will automatically run stability analysis on your data and turn any unstable points or conditions red:
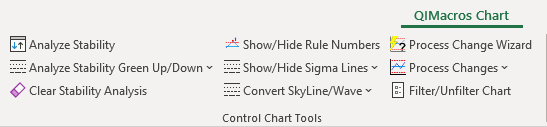
- If you add data, delete a point, ghost a point, or show a process change on a control chart, you should re-run stability analysis on your data. To do this, click on the QI Macros Chart Menu and select "Analyze Stability":

NOTE: Visual representation of your ghosted point(s) will be removed from the data point when stability analysis is run.
Analyze Stability Green Up or Green Down
A customer requested the ability to show "good" rule violations in Green depending on whether "up" (higher) is better or "down" (lower) is better. To use this stability analysis tool, click on the arrow next to Analyze Stability Green Up / Down:
Clear Stability Analysis
And you can clear stability analysis that will result in all of the data points and lines being shown in blue.
Control Charts Created with a Control Chart Template
To run stability analysis on a chart created using a control chart template:
- Select the chart to view QI Macros Chart Menu. Then select "Analyze Stability":
- If you have an X and an R (or S) chart you will need to select each chart and run stability analysis on each separately.
Learn More...
- Add Data to Control Charts
- Show Process Change on Control Chart
- Other QI Macros Control Chart Update Options
Stop Struggling with Control Charts!
Start creating your Control Charts in just minutes.
Download a free 30-day trial. Get Control Charts now!
QI Macros Draws These Charts Too!
