Need a Control Chart that Shows only the Most Recent Data?
QI Macros Control Chart Templates for Rolling Data are the Answer.
- Do you add new data every month but only want to see the most recent 12 months?
- Do you add new data every day but only want to see the most recent 30 days?
How to use QI Macros control chart templates for rolling data.
- Click on the QI Macros menu and select Control Chart Templates > Variable (XmR, XbarR/S) > XmR Five Pack:
- QI Macros control chart templates are actually made up of several worksheets. Click on the worksheet labeled "w Rolling" (e.g. XmR Chart w Rolling):
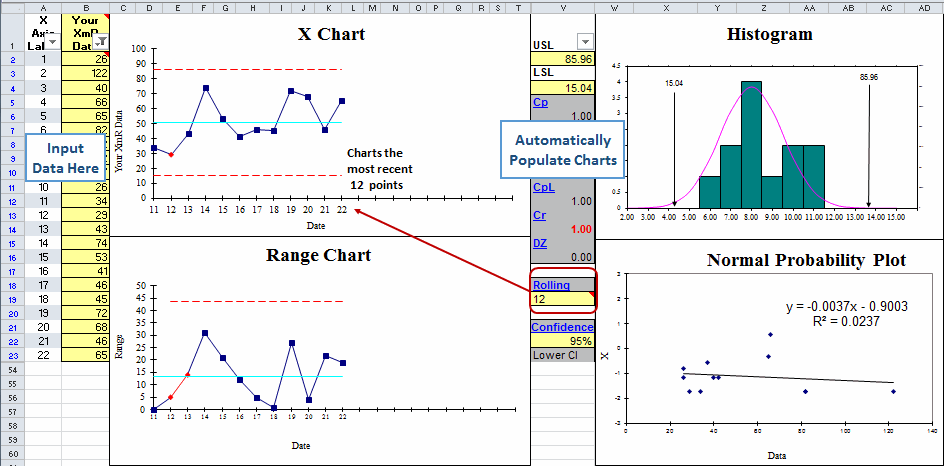
- Input your data into the yellow input area:
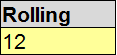
- To the right of the chart there is a yellow input box labeled Rolling.
- Input the number of points you want graphed - let's say 12:
- Now, even if your data contains 30 points, only the last 12 points will be graphed and used in the control limit calculations.
- If you add a new point, the chart and control limit calculations will roll off the 13th most recent point and add the new one.

![]()
Learn More About the Options in QI Macros Control Chart Templates.
NOTE: Filter/Unfilter functionality available within rolling templates, included in the January 2021 release of QI Macros.
Show Process Change and Fix Control Limits functionality available within rolling templates, included in the January 2022 release of QI Macros.
It is NOT possible to perform Ghost Point(s) on a rolling template.
Stop Struggling with Control Charts!
Start creating your Control Charts in just minutes.
Download a free 30-day trial. Get Control Charts now!
QI Macros Draws These Charts Too!
