Looking for a Cusum Chart Template in Excel?
QI Macros has a ready-made Cusum template for you!
Cumulative Sum Charts are Used to Detect Small Shifts in a Process
The Cusum Chart can detect process shifts more rapidly than the Individuals Moving Range (XmR) or XbarR Charts. If a trend develops, it's evidence that the process has shifted.
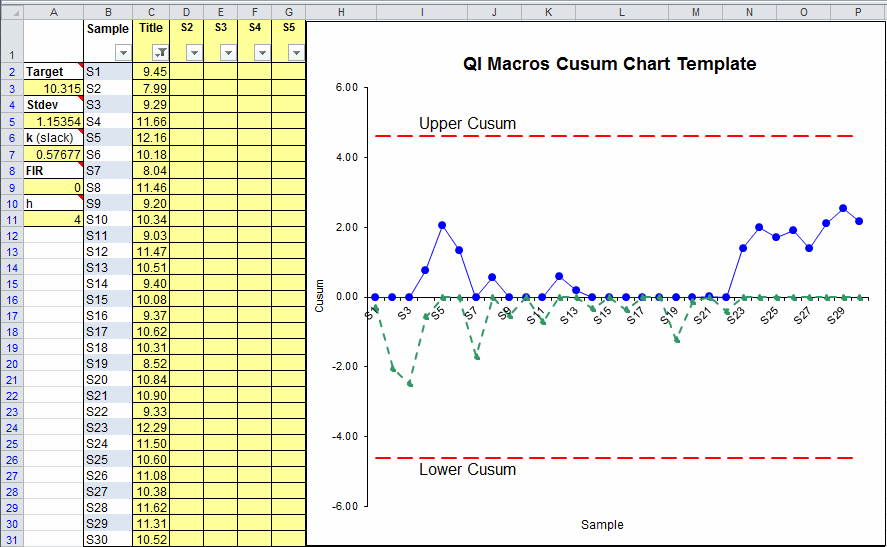
A Cusum Chart consists of the following:
- A target which is either provided by you or calculated as the mean of your data.
- Upper Cusum Limit and Lower Control Limit lines.
- C+ and C- lines which represent the cumulative sum of deviations of successive sample means from a target. Use these lines to determine if your process is shifting.
Cusum Chart Template in QI Macros for Excel:
QI Macros add-in for Excel contains an easy to use Cusum Chart template. The template is pre-populated with sample data to show you how the template works. Just delete the sample data or type your data over the filled in cells.
To Create a Cusum Chart:
- Input your Target value in cell A3.
- Input labels in column B and chart title in cell C1.
- Input data into columns C to G. Just use column C if your subgroup size is one. As you input data in columns C to G, the chart will populate to the right.
- St Dev in cell A5 and k (slack) in cell A7 will also be calculated. k (slack) defines the amount of shift from the target you want to be able to detect. This is an estimated value, calculated at 1/2 of StDev, but can be changed.
- Fast Initial Response (FIR) value defaults to 0. This feature can be used to set an initial "head start" value to improve detection of an out-of-control condition at the start of the chart. If the process is in control, this initial head start has little effect; if the process is out of control, a signal will be given faster with a non-zero value than with a zero value.
- h is called the threshold value or decision interval. It determines how many StDev from the mean the Cusum Limits are set.
NOTE: Using h=4 or h=5 and k=.5 will generally provide a cusum that has good ARL properties (per Montgomery SPC 4th ed.)
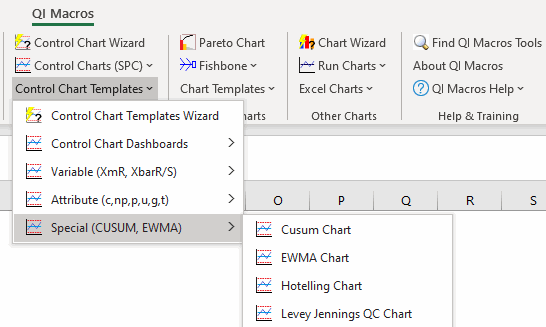
Find the Cusum Chart template by clicking on the QI Macros menu > Control Chart Templates > Special (CUSUM, EWMA) > Cusum Chart:
Cusum Template Options in QI Macros
![]()
- Cusum: Standard template and formulas.
- Cusum Warning Limits: Adds warning limit lines to chart (like 2 sigma lines on a control chart).
- Cusum 95-99 CI: Uses confidence intervals to calculate warning limits.
- Cusum FIR Adjusted: Uses an adjusted formula for k (slack).
Learn More...
- Compare Cusum Chart to XmR and EWMA
- Watch Cusum Chart video
- EWMA charts can also be used to detect small shifts in a process
Stop Struggling with CUSUM Charts!
Start creating your CUSUM Charts in just minutes.
Download a free 30-day trial. Get CUSUM Charts now!
QI Macros Draws These Charts Too!
