Cusum Charts
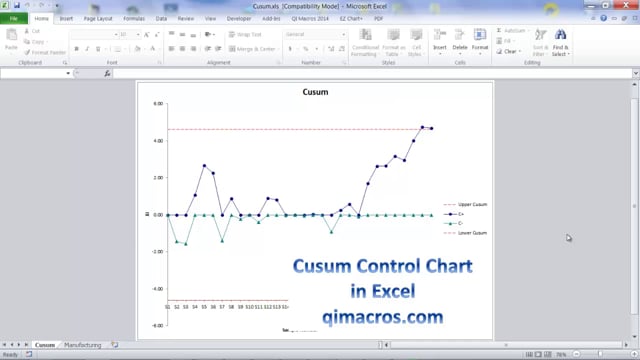
Watch this cusum chart video to see how easy it is to create a cusum chart in Excel using the QI Macros.
Learn More About Cusum Charts
Cusum charts (Cumulative Sum Charts) evaluate stability of processes using variable data--time, cost, length, weight.
The Cusum chart can detect process shifts more rapidly than the XmR or XbarR. If a trend develops, it's evidence that the process has shifted.
Why wait? Start creating these charts and diagrams in seconds using
QI Macros add-in for Excel.
« Back
Join 100,000+ Users
in 80 Countries

Why Choose QI Macros ?
Affordable - Just $
379 USD per license
- Less with Quantity Discounts
- No Recurring Annual Fees
- No Charge for Technical Support
Easy to Use
- Adds New Tab to Excel's Menu
- Creates a Chart in Seconds
- PC / Mac: Excel Excel 2021-2024, Office 365
Trusted /
Accurate
- 100,000 Users in 80 Countries
- Save Time vs Writing Formulas
- Our Formulas Are Tested

KnowWare International, Inc.
2696 S. Colorado Blvd., Ste. 555
Denver, CO 80222 USA
Toll-Free: 1-888-468-1537
Local: (303) 756-9144