Need a Real Time SPC Template for Excel?
QI Macros has a ready made template for you.
This Real Time SPC template for Excel, parses your data into subgroups and automatically draws control charts, histograms and calculates Cp and Cpk.
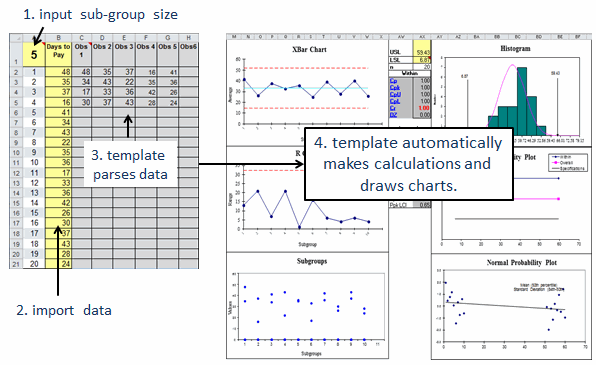
Here's how the real time spc template works:
- All input areas are shaded in yellow.
- Cell A1 defines the number of samples per subgroup.
- Column B is where you input your data (either manually or via a USB or RS 232 gage interface).
- Input spec limits for your histogram in cells AX1 and AX2.
- As data is input into column B, it is parsed by subgroup based on the value in cell A1. Here are two examples:
Subgroup size 2
Twenty points parsed into 2 columns
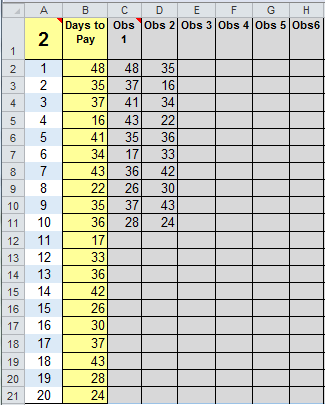
Twenty points parsed into 2 columns
Subgroup size 5
Twenty points parsed into 5 columns
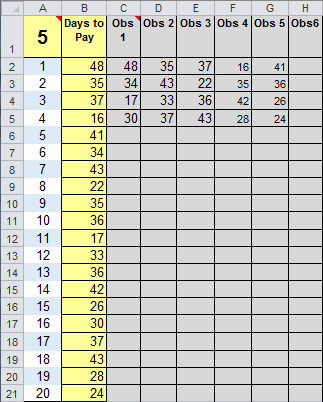
Twenty points parsed into 5 columns
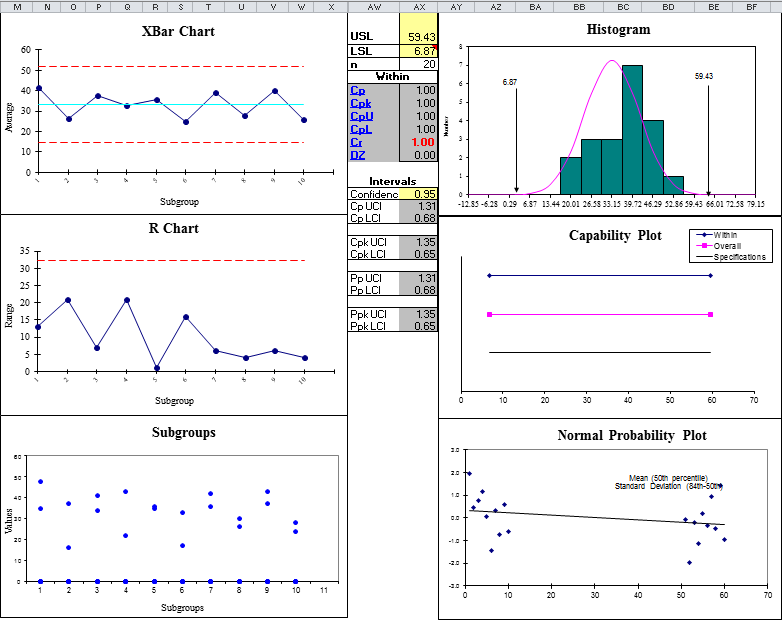
- As data is input and then parsed by subgroup, the charts are automatically populated to the right.
This template is part of QI Macros SPC Addin for Excel.
QI Macros adds a new tab to Excel's toolbar. To open the template, click on QI Macros, Control Chart templates > Variable (XmR, XbarR/S) > XbarR Six Pack.

The XbarR template has several tabs. Click on "XbarR Realtime."
Stop Struggling with Real time SPC Charts!
Start creating your Real time SPC Charts in just minutes.
Download a free 30-day trial. Get Real time SPC Charts now!
QI Macros Draws These Charts Too!
