Looking for a control chart that will scroll through your data?
QI Macros Control Chart Scrolling Templates are the Answer.
How to use QI Macros scrolling templates to look backward and forward through your data.
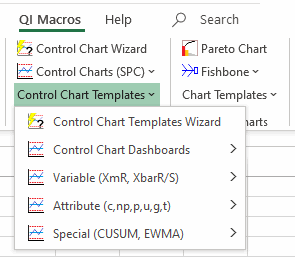
- Click on the QI Macros menu and select Control Chart Templates:
- Click on one of the control chart templates to open it (e.g. Variable > XmR Chart).
- QI Macros control chart templates are actually made up of several worksheets. Click on the worksheet labeled "Scrolling" (i.e. XmR Chart Scrolling):
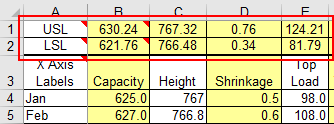
- Input your data into the yellow input area and the chart will automatically populate to the right:
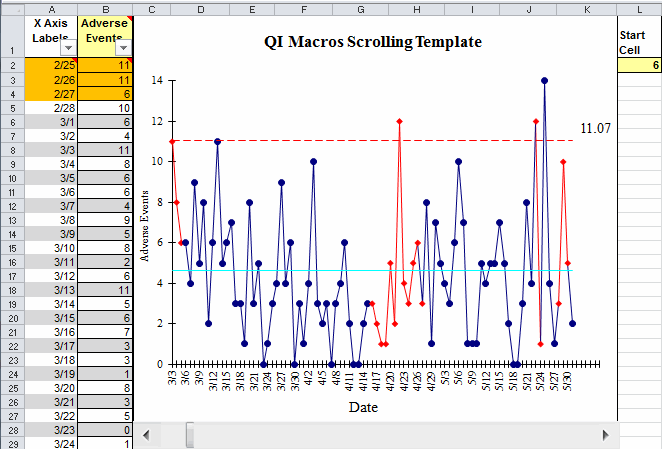
- The template provides two ways to scroll through your data:
- Input the starting value in the "Start Cell" to the right of the chart (i.e. cell L2).
- Use the scroll bar below the chart. Click on the arrows or on the bar itself to move backwards and forwards through your data.
![]()
Tip: If column A contains special formatting (e.g., dates), you may need to select column C (may vary by chart) and change the format to match column A.
Note: The c, np, p and u chart use all of the data to calculate limits. XmR and XbarR use the first 50 data points to establish limits.
NOTE: Filter/Unfilter functionality available within rolling templates, included in the January 2021 release of QI Macros.
The XmR Chart Dashboard now includes a scrolling dashboard option!
To use this tool:
(Included in the April 2020 release)
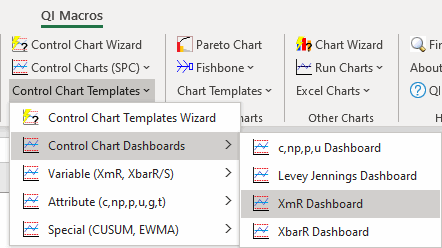
- Click on the QI Macros menu and select Control Chart Templates > Control Chart Dashboards:
- Input your data in the "Data Sheet" tab:
- Next, select the "XmR Scrolling" tab:
- Once you have done so, click the "Create XmR Dashboard" button:
![]()
Note: The XmR Chart uses the first 50 data points to establish limits.
Learn More About Control Chart Template Options...
- Control Chart with Rolling Data and Control Limits - graphs the most recent data points as defined by you.
- Control Chart with Fixed Control Limits - allows you to enter fixed or historical control limits.
Stop Struggling with Control Charts!
Start creating your Control Charts in just minutes.
Download a free 30-day trial. Get Control Charts now!
QI Macros Draws These Charts Too!
