Looking for an Individuals ImR/XmR Capability Chart Template in Excel?
QI Macros has one READY-MADE for you!
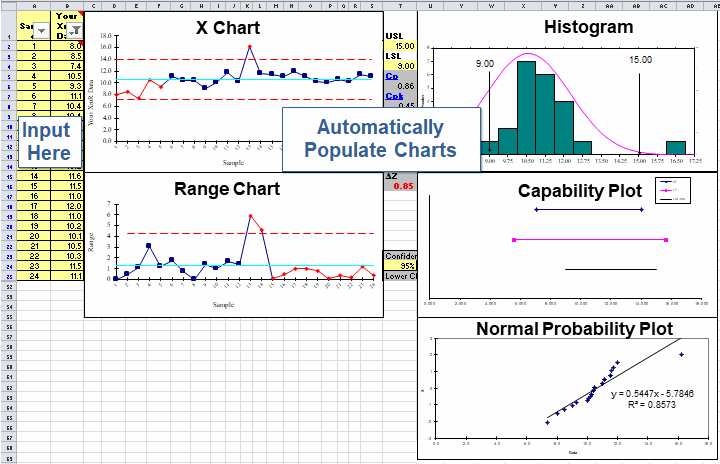
Use an Individuals Moving Range Capability Chart (XmR chart) to evaluate the stability of processes using variable data--time, cost, length, weight when the sample size is one. Set USL/LSL to calculate Cp and Cpk capability metrics.
Create an XmR Control Chart and Capability Analysis using QI Macros and Excel
- Select your data.
- Click on QI Macros menu > Control Charts (SPC) > Control Chart Templates Wizard.
- QI Macros will open the correct template and paste in your data.
- Then update the LSL/USL to calculate Cp and Cpk..
Just type your data into the yellow input area and the control charts, histogram and probability plot will be drawn to the right. You can also cut and paste data from another spreadsheet into the template.
Listen to our XmR Chart podcast below!
* Generated using QI Macros' source material via an AI model *
The Individual Moving Range (XmR) Chart template has several worksheets:

Learn more about these control chart template options.
Stop Struggling with XmR Charts!
Start creating your XmR Charts in just minutes.
Download a free 30-day trial. Get XmR Charts now!
No credit card required
Not a subscription
PC or Mac
QI Macros Draws These Charts Too!