Need a Control Chart Template Where the Center Line = Median?
QI Macros has median chart templates for all variable control charts!
QI Macros default control chart template uses the average of your data to calculate the center line on your control chart. The 1 and 2 sigma lines and the upper and lower control limits are derived from this average.
QI Macros variable control chart templates also contain a median control chart option. These templates use the median of your data to calculate the center line and control limits. The median is defined as the middle number in your data set after it has been sorted in numerical order.
To use QI Macros median control chart templates:
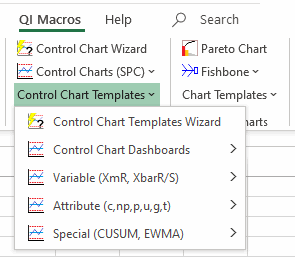
- Click on the QI Macros menu, Control Chart templates, then select one of the templates (i.e. XmR Five Pack):
- Click on the worksheet labeled Median (e.g. XmR Median R):

- Data input areas are shaded in yellow. As you input data, the charts populate to the right:
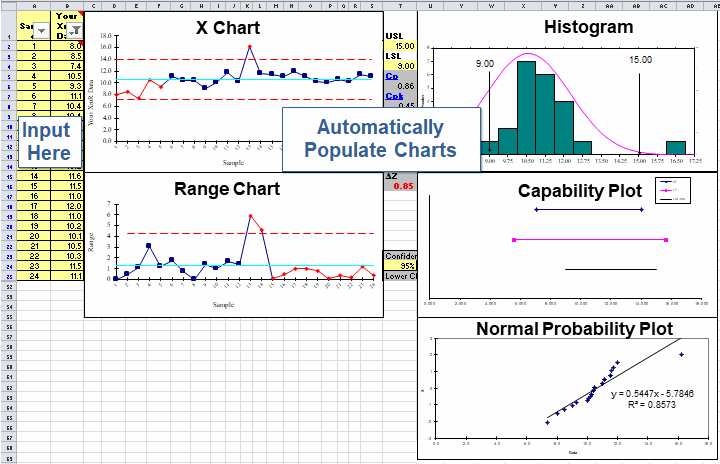
- X chart templates have input areas to define spec limits for the histogram:

Stop Struggling with Control Charts!
Start creating your Control Charts in just minutes.
Download a free 30-day trial. Get Control Charts now!
QI Macros Draws These Charts Too!
