XmR Individuals Chart Formulas
QI Macros can calculate them for you!
Draw an XmR Chart using QI Macros
- Select your data.
- Select XmR on QI Macros menu.
- QI Macros will do the math and draw the graph for you.
Go Deeper
The XmR (Individuals and Moving Range) Chart can help you evaluate a process when there is only one measurement and they are farther apart: monthly postage expense and so on.
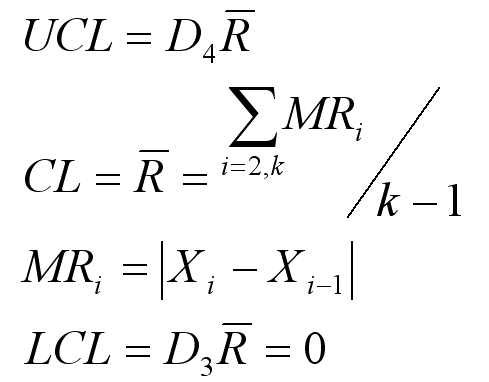
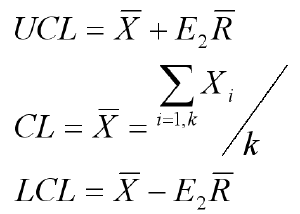
Formulas for the Moving Range and Individuals chart in QI Macros.
Moving Range Chart formula

Individuals X Chart formula

k = number of data points
for n=2 observations (moving range is calculated from two samples, the present minus the previous value)
D4 = 3.267
D3 = 0
E2 = 2.660
Conforms with ANSI/ASQC B1, B2, B3 1996
NOTE: It is possible to have negative limits on an XmR Chart.
QI Macros XmR Charts employ the Nelson Rule for Moving Range
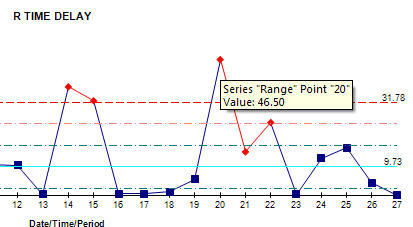
"Any moving range (Ri) greater than 3.5*Rbar should be removed from the average moving range calculation."
In example below, point 20 (46.50) is greater than 3.5*11.14 (original Rbar), so it will be removed from Rbar Calculation which changes Rbar to 9.73 and UCL/LCL for both the X and R charts.
Source: Control Charts for Individual Measurements, Lloyd S. Nelson, Journal of Quality Technology, Vol. 14, No. 34, July 1982.

Process: Calculate, plot, and evaluate the range chart first. If it is "out of control," so is the process. If the range chart looks okay, then calculate, plot, and evaluate the X Chart.
Other Resources
- Create a XmR Individuals Chart in Excel using QI Macros
- XmR Individuals Chart Video
- XmR Individuals Chart Template in Excel
The XmR Individuals chart is just one of the tools included in the QI Macros SPC Software for Excel.
Stop Struggling with XmR Individuals Charts!
Start creating your XmR Individuals Charts in just minutes.
Download a free 30-day trial. Get XmR Individuals Charts now!
Why Choose QI Macros Over Other Control Chart Software?
![]()
Fast and Easy to Use
- Works right in Excel
- Create charts in seconds
- Easy to customize & share charts
- Free Training Anytime
![]()
Proven and Trusted
- More than 100,000 users
- In More than 80 countries
- Five Star CNET Rating - Virus free
![]()
Affordable
- Only $369 USD
Quantity Discounts Available - No annual subscription fees
- Free technical support

