Struggling with Control Chart and Capability Formulas?
QI Macros Can Calculate Them For You!
Create any Control Chart using QI Macros
- Select your data.
- Select the chart on QI Macros menu.
- QI Macros will do the math and draw the graph for you.
Give Me Five Minutes and I'll Have You Drawing Accurate Control Charts and Histograms
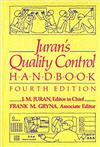
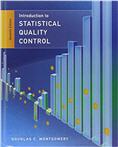
QI Macros control chart formulas, capability analysis formulas and other calculations are taken from widely accepted SPC References including, Montgomery, Breyfogle, Juran and NIST. The exact formulas and other information for each chart can be found by clicking on the links below:
Control Chart Formulas Used in QI Macros
Attribute Control Charts
Other QI Macros Control Chart Calculation Information
Stop Struggling with Control Charts!
Start creating your Control Charts in just minutes.
Download a free 30-day trial. Get Control Charts now!
Process Capability Analysis Formulas Used in QI Macros
- Cp, Cpk Formulas
- Pp, Ppk Formulas
- Cp Cpk vs. Pp Ppk
- Histogram Metrics including % Defects, PPM, Sigma and Z scores
- Histograms - # of Bars
Download a free pdf of histogram formulas and sample calculations (PDF, 153 KB)
If you still need more help after reading the following information and our free pdf, consider our Histogram White paper.
Six Sigma and SPC Reference Books
If you want a good Lean Six Sigma reference, consider my Lean Six Sigma DeMYSTIFieD book:
If you don't have a good statistical reference book, I can recommend:
Montgomery Instructor Companion Site includes
Data Sets Referenced in Montgomery's book
Automotive Industry
Action Group Resources
- Statistical Process Control (2nd), AIAG 2005
- Measurement Systems Analysis (4th), AIAG, 2010
Why Choose QI Macros Over Other Control Chart Software?
![]()
Fast and Easy to Use
- Works right in Excel
- Create charts in seconds
- Easy to customize & share charts
- Free Training Anytime
![]()
Proven and Trusted
- More than 100,000 users
- In More than 80 countries
- Five Star CNET Rating - Virus free
![]()
Affordable
- Only $369 USD
Quantity Discounts Available - No annual subscription fees
- Free technical support


