Need to Calculate Process Capability Metrics?
QI Macros will calculate them for you!
You Don't Need to Learn Formulas - You Just Need the Right Software
QI Macros Histogram calculates several process capability analysis metrics for you so you don't need to learn any formulas. However, if you want to dive deeper, descriptions and formulas for these metrics are described below.
- Cp and Cpk Process Capability Metrics
- Pp and Ppk Process Performance Metrics
- Other Process Metrics
- Why did My Metrics Turn Red?
Other Process Capability Metrics
Capability Ratio - Cr Formula
The Capability Ratio indicates what proportion of tolerance is occupied by the data.
Cr = 1/Cp
Cp = 1.33 ~ Cr = 0.75 (data fits 75% of tolerance)
Cpm Formula
The Cpm is an uncommonly used Capability Index that can be used when you have a target value.
Cpm = (USL-LSL)/(6√(sigma2+(Xbar-Target)2)
Cm and Cmk versus Cp and Cpk/Pp and Ppk
Cm and Cmk are machine capability indices, while Cp/Cpk and Pp/Ppk are process capability and performance indices.
- Cm is a statistical measure used to evaluate the potential capability of a specific machine to produce parts within specified tolerance limits. It assesses the inherent variation in a machine’s output when the machine is operating under controlled conditions.
A Cm value of 1.33 or higher is often considered acceptable in many industries.
Cm focuses on the overall variability of the machine’s output relative to the specification limits, without considering the centering of the output.
- Cmk is similar to Cm but also takes into account how well the machine's output is centered within the specified tolerance limits. It provides a more accurate assessment of the machine's capability by considering both the variation and the centering of the machine's output.
A higher Cmk value indicates better machine capability and centering. If Cmk is significantly lower than Cm, it suggests that the machine’s output is off-center relative to the specification limits.
Cmk takes both variability and centering into account, providing a more comprehensive measure of the machine's capability to consistently produce within the desired specification limits.
Min-Max
Min = Min(Xi)
Max = Max(Xi)
Z Score
Z scores help estimate the non-conforming PPM.
Z scores standardize +/-3*stdev values into +/-3.
Zlower = (Xbar-LSL)/stdev
Zupper = (USL-Xbar)/stdev
Zbench
Zbench = normsinv(1-(Expected PPM/1,000,000)) Zbench is the Z score for the Expected PPM
ZTarget/Delta Z
ZT (target) = ΔZ= |Xbar-Target|/(stdev)
Ztarget measures how far the average varies from the Target.
ZT < 0.5 is desired (less than 1/2 standard deviation from target)
The target is assumed to be the midpoint between the USL and LSL.
Sample Size Calculator
Variable
Sample Size (SS) = (ZStdev)/Confidence2
Where:
Z = 1.96 for 95% confidence level
Stdev = standard deviation (or 0.5 Default)
Confidence interval expressed as decimal (e.g., .05 = ±5%)
Attribute
Sample Size (SS) = (Z2p(1-p))/Confidence2
Where:
Z = 1.96 for 95% confidence level
p = percent defects (0-0.5 = 0-50%)
Confidence interval expressed as decimal (e.g., .05 = ±5%)
Correction for Finite Population
new sample size = SS/(1+ (SS-1)/population)
Defects
defects = number of points outside USL-LSL
% Total Defects = (defects100)/(Total points)
Parts Per Million (PPM) and Expected PPM
PPM = % Total Defects*1000000
Expected PPM = (Normsdist(Zlower) + (1-Normsdist(Zupper)))1,000,000
- Expected PPM Short Term (ST), "Within" uses sigma estimator (Rbar/d2 or Sbar/c4)
- Expected PPM Long Term (LT), "Overall" uses standard deviation.
Sigma
If observed PPM > 0, it uses the observed value to calculate Sigma.
If observed PPM = 0, it uses Expected PPM to calculate Sigma.
If both are zero, it defaults to 6 sigma.
If there are no USL/LSL, it leaves it blank.
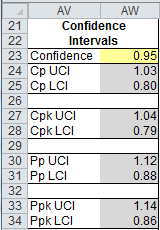
Confidence Interval
The Confidence Interval within QI Macros is set at 95%. However, in the Capability Suite, XbarR and XmR chart templates and dashboards you can set it to your choosing. You will find the settings between the control charts and histogram just below the specification limit settings.
Skewness
A "Skewness" value refers to the degree of asymmetry of a distribution around its mean. Positive skewness indicates a distribution with an asymmetric tail extending toward more positive values. Negative skewness indicates a distribution with an asymmetric tail extending toward more negative values.
Why did My Metrics Turn Red?
- Cp = If Cp > Pp or Cpk > Ppk. Your process is unstable or data was sorted.
While Cp should be greater than Pp, it should not be dramatically greater. If so, the process is unstable. - Cpk = If Cp > Cpk or Cpk > Ppk. Your process is unstable or data was sorted.
- Cr = If Cr is greater than or equal to 1, value turns red. (Cp < 1.0), Cr < 1 then value is not red.
- ZTarget/∆Z = If ∆Z > 0.5, value turns red. Target = (USL-LSL)/2.
- Pp = If Cp > Cpk or Cpk > Ppk. Your process is unstable or data was sorted.
- Ppk = If Cp > Cpk or Cpk > Ppk. Your process is unstable or data was sorted.
Stop Struggling with !
Start creating your in just minutes.
Download a free 30-day trial. Get now!
QI Macros Draws These Charts Too!
