Tired of using Excel's Data Analysis Toolpak to Draw Histograms?
QI Macros has a ready made histogram template for you.
Just drop your data into QI Macros template and the histogram is drawn for you.

To use QI Macros Excel histogram template:
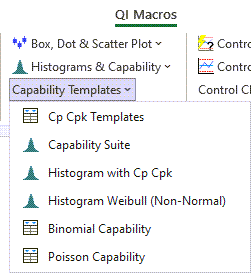
- Just click on QI Macros Menu, Capability Templates and Histogram with Cp Cpk.
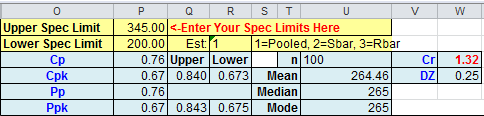
- Input your data and spec limits into the yellow shaded areas on the Excel worksheet.
- The histogram chart and bell curve is created to the right.
- Process capability metrics Cp Cpk Pp Ppk are calculated using sigma estimator.
- To switch between estimators, change cell R2 to 1) Pooled SD, 2) Sbar or 3) Rbar estimators:
What Else is Cool about QI Macros Histogram Template for Excel?
Interactive Features: Change the spec limits or sigma estimator formula to see how it impacts Cp Cpk and Pp Ppk.
Multiple Template Options: The template is actually made up of several worksheets:

- Use the Compare Two Histograms Template to view two histograms on the same worksheet.
- Histogram Between-Within: uses slightly different formulas for Cp and Cpk.
- Use the Histogram template for Weibull Analysis to analyze failure rates.
Stop Struggling with Histograms!
Start creating your Histograms in just minutes.
Download a free 30-day trial. Get Histograms now!
QI Macros Draws These Charts Too!
