Trying to Create Between/Within Histograms in Excel?
QI Macros can create them for you in seconds!
Create a Between/Within Histogram using QI Macros:
- Select your data.
- Click on QI Macros menu > Histogram & Capability > Histogram Between/Within.
- QI Macros will do the math and draw the chart for you.
Step by step instructions to create a Between/Within Histogram using QI Macros.
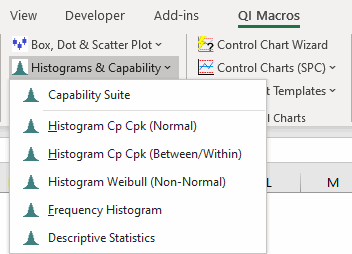
Used to represent the Potential Process Tolerance, you can create a Histogram Cp Cpk (Between/Within) chart within Excel by selecting your data set and clicking on the "Histograms & Capability" drop-down menu > "Histogram Cp Cpk (Between/Within)":
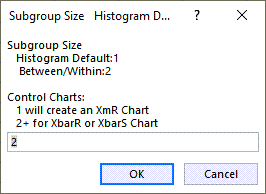
If you have a single-column set of data, you will receive the following "Subgroup Size" prompt - enter "2", as it is required to have a minimum of 2 subgroups of data to perform a Between/Within Histogram:
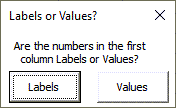
If you have multiple columns of data and receive the following prompt, select "Values" if your first column of data is NOT a label:
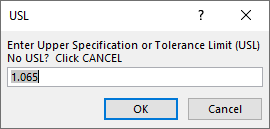
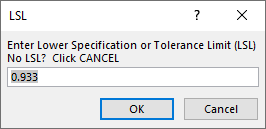
Then, input your Upper and Lower Specification Limits when prompted. If you do not have one, USL/LSL will be calculated for you - select "OK" for each prompt:
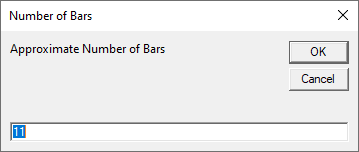
You will also be asked for the "Approximate Number of Bars." If you do not know the approximate number of bars you would like on your Histogram, press "OK":
Once completed, a Between/Within Histogram is created:
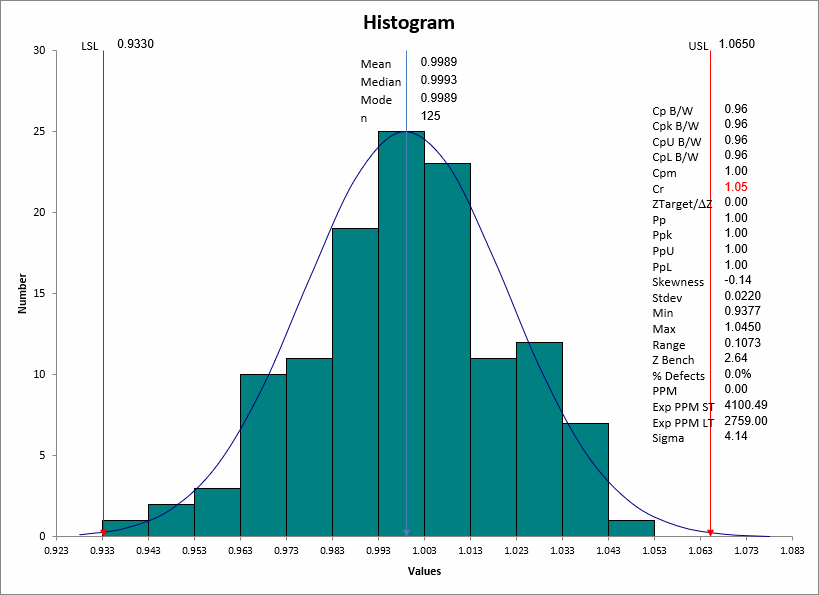
NOTE: The Between/Within Histogram uses between/within-subgroup standard deviation, instead of overall standard deviation.
Between/Within Histogram Template
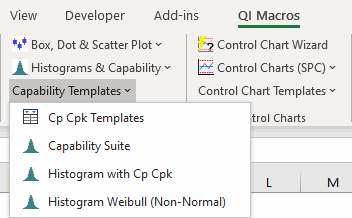
Or you can use our Histogram template to create a Between/Within Histogram! To do so, click on the "Capability Templates" drop-down menu > "Histogram with Cp Cpk":
Next, select the "Histogram Between/Within" tab to open the template:

Lastly, input your data set in columns A through J, and enter your Upper and Lower Spec Limits in Q1 and Q2 (It is required to have a minimum of 2 columns of data to perform a Between/Within Histogram):
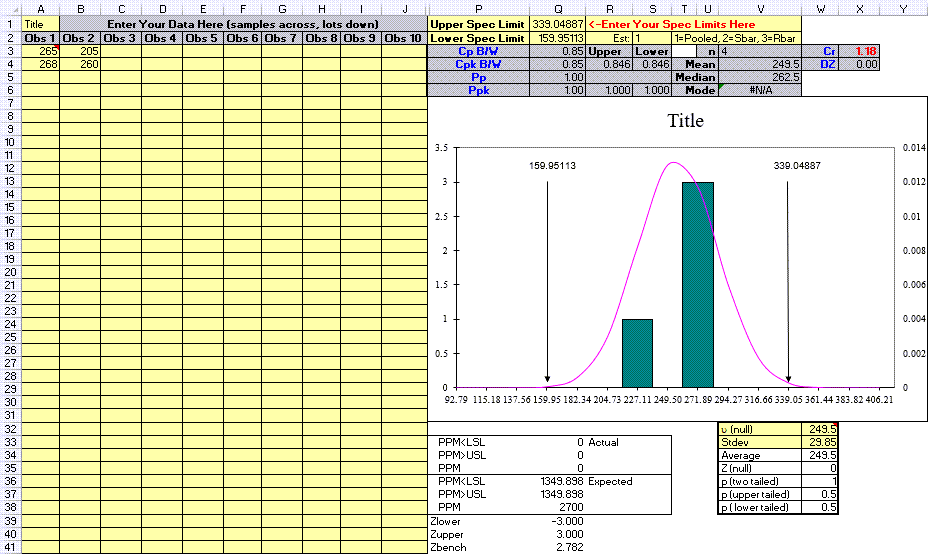
NOTE: The Estimator is defaulted to Pooled Standard Deviation (1) in cell S2, however you can change the Estimator to Sbar (2) or Rbar (3).
Stop Struggling with Histograms!
Start creating your Histograms in just minutes.
Download a free 30-day trial. Get Histograms now!
QI Macros Draws These Charts Too!
