Struggling with Histogram Bin Width and Bin Intervals?
QI Macros add-in for Excel can calculate these for you!
Draw a Histogram using QI Macros
- Select your data.
- Select Histogram on QI Macros menu.
- QI Macros will do the math and draw the graph for you.
Here's How to Calculate the Number of Bins and the Bin Width for a Histogram
- Count the number of data points.
- Calculate the number of bins by taking the square root of the number of data points and round up.
- Calculate the bin width by dividing the specification tolerance or range (USL-LSL or Max-Min value) by the # of bins.
Bin Width = (Max-Min)/sqrt(n)
There are Two Ways to Create Histograms

The Hard Way
manually or using Excel
YOU need to calculate:
the number of bins bin width bin intervals.
The many steps are described below.

The Easy Way
using QI Macros add-in for Excel.
It calculates the bins and widths automatically
and draws the chart for you.
Download a free 30 day trial and
you'll have a histogram in minutes.
Here's the Hard Way
Calculate Bins and Bin Width
Description |
Example of Calculation In Excel |
|---|---|
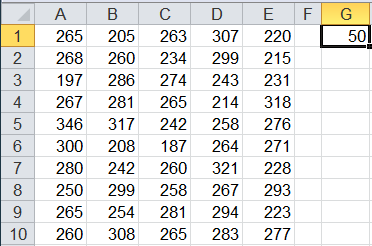
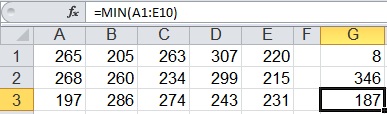
Step 1: Count the Number of Data Points Let's say we have 50 data points. If your data is in Excel, use Excel's count function to determine the number of data points. |
 |
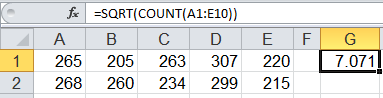
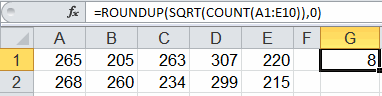
Step 2: Calculate the # of Bins, then round up # of bins = square root of the # of data points the square root of 50 = 7.071, round up to 8 In Excel, add the SQRT function to your calculation then add the Roundup function. |
|
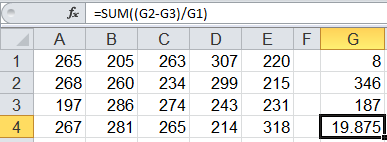
Step 3: Calculate the Bin Width Bin width = Spec Tolerance or Range ÷ number of bins
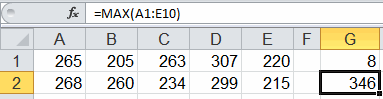
If we use the range for this example: Bin width = (Max-Min) ÷ Number of bins Bin width = (346 - 187) ÷ 8 = 19.875
|
|
Now Create a Histogram in Excel Using These Bin Widths
Bin intervals need to span enough distance to include the upper and lower spec limits and the min and max values. Using the data in the previous example, follow these steps to determine bin intervals for a histogram:
- select a beginning point that is lower than or equal to both the lower spec limit and the min value
- calculate bin intervals in Excel by taking the beginning value + the bin width, + the bin width, etc.
- round the calculated values if desired
- select an ending point that is higher than or equal to both the upper spec limit and the max value
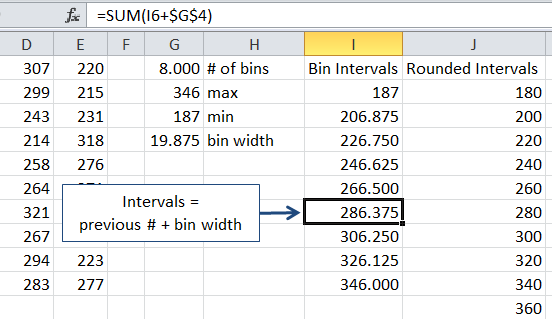
Note: Upper and lower specification limits are determined by the customer of the process. If you don't have spec limits, use the maximum and minimum values.
 loading="lazy"
Juran's Guidelines for Number of Bars
Juran's Quality Control Handbook provides these guidelines for the number of bars and states that they are not "rigid" and should be adjusted when necessary.
| Number of Data Points | Number of Bars | Number of Data Points | Number of Bars | |
| 20-50 | 6 | 201-500 | 9 | |
| 51-100 | 7 | 501-1000 | 10 | |
| 101-200 | 8 | 1000+ | 11-20 |
Stop Struggling with Histograms!
Start creating your Histograms in just minutes.
Download a free 30-day trial. Get Histograms now!
QI Macros Draws These Charts Too!
