Are You Making One of these Common Histogram Errors?
QI Macros add-in will help you create mistake-proof histograms in seconds.
Draw a Histogram using QI Macros:
- Select your data.
- Select Histograms & Capability from QI Macros menu.
- QI Macros will do the math and draw the graph for you.
Here are a few of the most common errors users make when drawing histograms.
Sorting Individuals Data
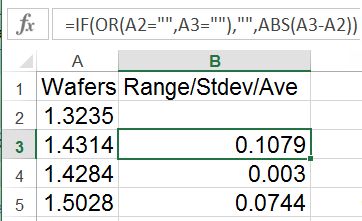
Process capability metrics formulas use the range as part of the sigma estimator formula. Ranges are calculated as the difference between consecutive data points. For example, cell B3 below is the difference between A3 and A2.
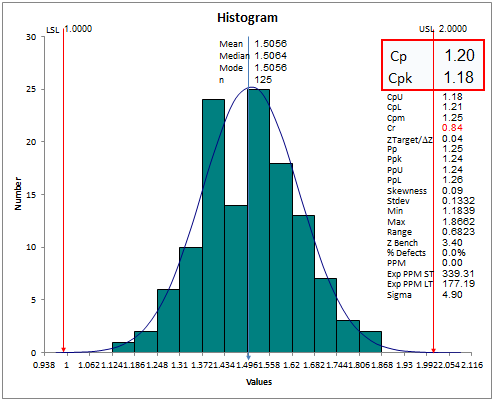
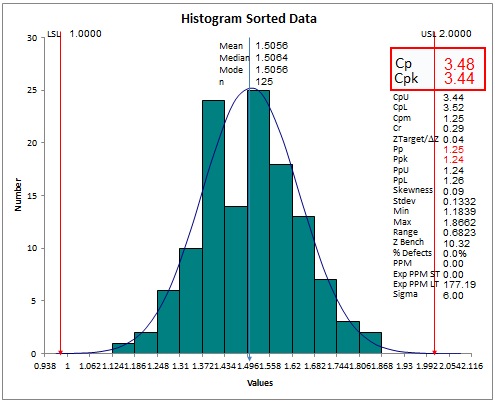
When you sort the data, it eliminates the natural range between each individual measurement and substitutes an artificial one that's very small. When you do this, Cp and Cpk increase dramatically. Below are two histograms using the same data. The first one has data with normal variation; the second one has sorted data.
Notice the graphs look the same BUT the Cp and Cpk values are different.
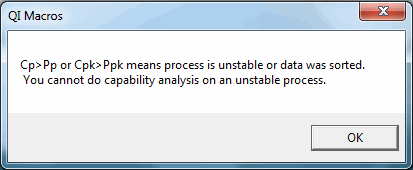
Tip: When Cp and Pp, or Cpk and Ppk differ dramatically, the data might have been sorted or the process may be too out of control for analysis.
QI Macros mistake proofs your analysis by comparing Cp to Pp and Cpk to Ppk. If the differences are significant, an error box will pop up and the Cp Cpk and Pp Ppk values will be turned red.
Using Individuals Data Instead of Subgroups
Many machines produce single columns of data, but the data is actually in subgroups (e.g. "batches" with five samples each.) When you have data with subgroups, the range or standard deviation should be calculated for each subgroup.
QI Macros contains a prompt when the Histogram detects individuals data. If you see this prompt, enter the number of samples per subgroup (default is 1):
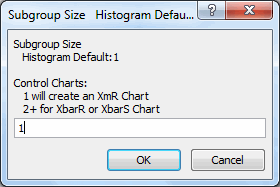
Tip: a subgroup is a group of measurements produced under the same set of conditions.
Using the Wrong Formulas - Cp, Cpk vs Pp, Ppk
Some people still try to calculate Cp and Cpk using standard deviation, not Sigma estimator. Standard deviation is used to calculate Pp and Ppk.
Stop Struggling with Histograms!
Start creating your Histograms in just minutes.
Download a free 30-day trial. Get Histograms now!
QI Macros Draws These Charts Too!
