Confused About Process Stability vs Process Capability?
QI Macros can do BOTH at the Same Time!
Create a Capability Suite using QI Macros:
- Select your data.
- Click on QI Macros menu > Histograms & Capability > Capability Suite.
- QI Macros will do the math and draw the charts for you.
What's the difference between control limits and specification limits?
Many people confuse control limits on control charts with specification limits used on histograms.
- Control limits are calculated from your data and are used to evaluate the stability of a process.
- Spec limits are provided by your customers and are used evaluate the capability of a process.
Analyzing Stability
A stable process produces PREDICTABLE RESULTS CONSISTENTLY. Process stability can be easily determined using control charts. A control chart is a line graph of your data (the same line graph used to identify and focus your problem) with average and sigma lines to determine stability. The average and sigma lines (∓ 1, 2 and 3 sigma) are calculated from the data. The Upper Control Limit (UCL) is the +3 sigma line and the Lower Control Limit (LCL) is the -3 sigma line. 99.7% of all data points will fall between these two limits.

QI Macros control charts identify unstable points or trends for you and highlight them in red.
Analyzing Capability
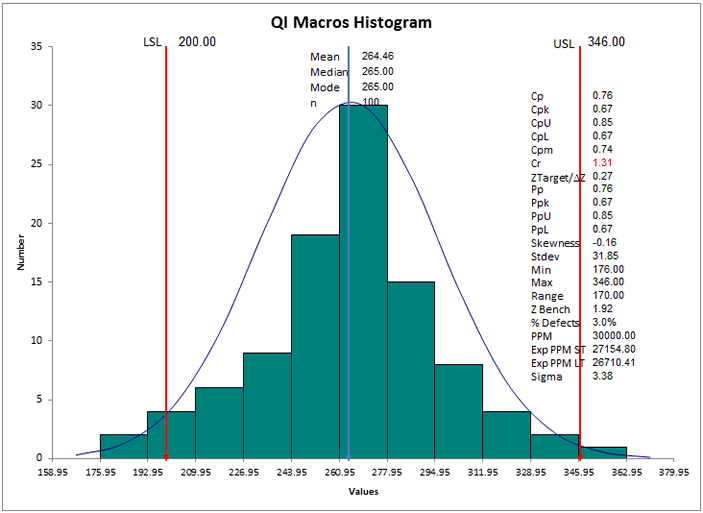
A capable process MEETS THE CUSTOMER'S REQUIREMENTS 100% OF THE TIME. The Upper and Lower SPECIFICATION limits (USL and LSL) are determined from the customer's requirements.
The histogram is the correct tool to analyze process capability. QI Macros histogram will calculate the process capability measures (Cp, Cpk, Pp and Ppk) based on your data and on the specification limits. To run a histogram, select your data and then select histogram from QI Macros menu. The macro will prompt you for the spec limits:
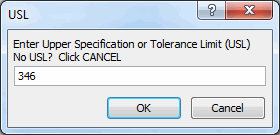
If you don't know the specification limits, the QI Macros will calculate them for you. You can click OK to use the default, input your spec limit or click cancel if you have one-sided or unilateral spec limits.
Determining Capability Using Attribute Data
The capability of counted (i.e. attribute) data like defects, indivisible integers only, is zero defects. Customers hate defects, outages, etc. The capability of measured (i.e. variable) data like time, money, age, length, weight, etc. is determined using the customer's specifications and a histogram.
Determining Capability Using Variable Data
When a customer defines an upper and/or a lower specification limit for a product or service, whether it's the diameter of a shaft or the time in line at a fast food restaurant, all points within the two limits are considered "good."
- Use Cp and Cpk when your data represents a sample
- Use Pp and Ppk when your data represents the whole population
- The capability index (Cp) indicates how well the data would fit between the USL and the LSL if the process average were centered between the specification limits.
- Cpk on the other hand helps indicate how centered the data is within the range.
If Cp = Cpk, the process is centered at the midpoint of the specifications.
if Cp>Cpk, then the process is off-center. - If both Cp and Cpk are greater than or equal to 1 then the process is considered capable.
Download Histogram Cp Cpk Cheat Sheet
You can calculate Cp, Cpk and Pp, Ppk without running a histogram using the Cp Cpk template.
Stop Struggling with Stability and Capability Analysis!
Start creating your Stability and Capability Analysis in just minutes.
Download a free 30-day trial. Get Stability and Capability Analysis now!
 Take our FREE Lean Six Sigma Yellow Belt training online.
Join 100,000+ Users
in 80 Countries

