Looking for an Alternative to Minitab's Capability Sixpack™?
QI Macros add-in can run the same analysis right in Excel!
Create a Capability Suite using QI Macros:
- Select your data.
- Click on QI Macros menu > Histograms & Capability > Capability Suite.
- QI Macros will do the math and draw the charts for you.
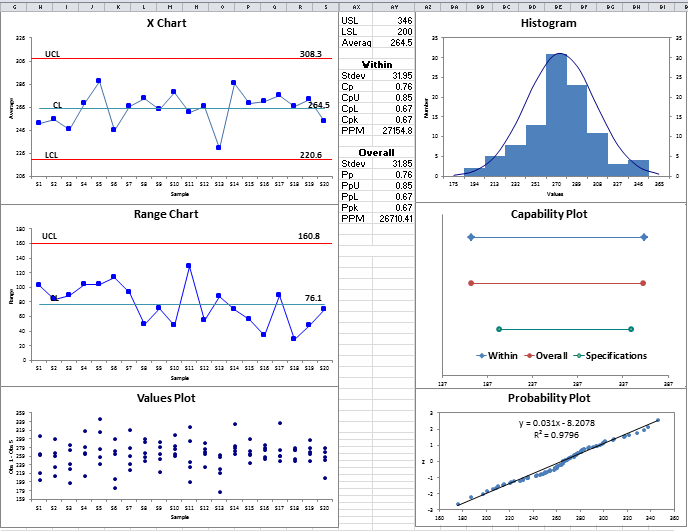
QI Macros Capability Suite creates control charts, histograms and more to give you a complete picture of stability and capability.
Same Six Charts for a Fraction of the Cost of Minitab's Capability Sixpack™
Minitab's Capability Sixpack™ is a similar tool. However, most people either can't afford it or if they own it, they don't know how to use it. These folks are thrilled when they discover QI Macros. QI Macros creates control charts, histograms, normal probability plots and more.
QI Macros Capability Suite contains:
- X Chart (XmR for individual data, Xbar for 2+ samples) to evaluate stability.
- Range or Standard Dev Chart dependent upon your sample size (R for n < 9; S for n > 8) to evaluate stability.
- Values Plot of individual data points.
- Histogram with Cp, Cpk, Pp, Ppk to evaluate capability.
- Probability Plot for analysis of normality of the data.
- Capability Plot of within and overall variation vs specification limits.
Stop Struggling with Capability Analysis!
Start creating your Capability Analysis in just minutes.
Download a free 30-day trial. Get Capability Analysis now!
QI Macros Draws These Charts Too!
