Don't Understand Cpk vs Ppk or Cp vs Pp?
QI Macros Excel add-in will calculate them all for you.
What is the difference between Cp, Cpk & Pp, Ppk?
Cp and Cpk |
|---|
Cp is the capability index. |
Cpk is the centering capability index. |
Use Cp Cpk when you have a sample, not the population, and are testing the potential capability of a process to meet customer needs. |
Cp and Cpk use Sigma estimator. |
Pp and Ppk |
|---|
Pp is the performance index. |
Ppk is the performance centering index. |
Use Pp Ppk when you have the total population and are testing the performance of a system to meet customer needs. |
Pp, Ppk use standard deviation. |
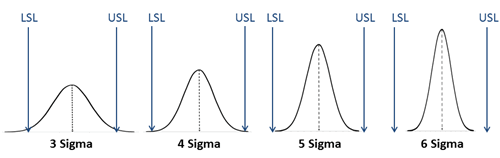
How do Cp and Cpk Relate to Sigma?
Cp Cpk |
1.0 |
1.33 |
1.66 |
2.0 |
|---|---|---|---|---|
Sigma |
3 Sigma |
4 Sigma |
5 Sigma |
6 Sigma |
% of Spec Tolerance Used |
100% |
75% |
60% |
50% |
 |
|---|
QI Macros Tools that Calculate Cp, Cpk, Pp, Ppk and Sigma
- Histogram - calculates Cp, Cpk, Pp, Ppk, Sigma and twenty other metrics using your data and spec limits.
- Capability Suite - creates six charts including histogram, control charts, probability plot, values plot and capability plot. Also calculates Cp, Cpk and Pp, Ppk.
- Cp Cpk Template - calculates Cp, Cpk and Pp, Ppk on multiple sets of data.
Stop Struggling with Capability Metrics!
Start creating your Capability Metrics in just minutes.
Download a free 30-day trial. Get Capability Metrics now!
QI Macros Draws These Charts Too!
