Confused about Cp Cpk vs Pp Ppk Formulas?
QI Macros Excel add-in will calculate them for you.
Why use QI Macros instead of calculating Cp Cpk and Pp Ppk yourself?
![]()
TIME
Unless you are already an expert, you will spend hours trying to figure out the calculations.
Why not download a QI Macros free trial and start doing it correctly immediately?
![]()
COMPLEXITY
There are several formulas to choose from and lots of places to make mistakes.
If you are like most folks, you will make an error somewhere. QI Macros calculations are tested and accurate.
![]()
ACCURACY
Chances are you are not doing this for the sheer fun of it.
If you're providing these results to customers, shouldn't you use a tool that's proven and reliable?
Go Deeper: Formulas and Other Considerations
Cp, Cpk Formula & Calculations
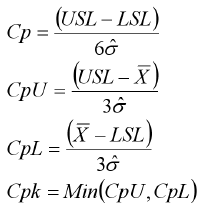
(Cpk > 1.33 is desirable)
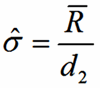
Cp and Cpk use Sigma Estimator
σ̂
Pp, Ppk Formula & Calculations
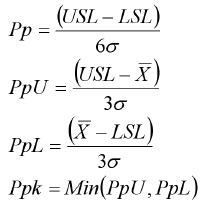
(Ppk > 1.33 is desirable)
Pp, Ppk use standard deviation
σ
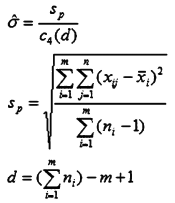
Sigma Estimator Calculation - Three Different Methods
Pooled Standard Deviation
Use when n > 2
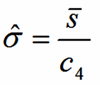
Average of the Subgroup Standard Deviations
Use when n > 4
c4 is a constant based on subgroup size
Sbar = Σ(σi)/n
Average of the Subgroup Ranges
Use when n = 1 to 4
d2 is a constant based on subgroup size
Rbar = Average(Ri) (Average of the Ranges in samples)
n = the subgroup size
QI Macros Works Right in Excel
QI Macros calculations use these defaults and make it easy to change methods if required:
- Pooled Standard Deviation when n >= 2 and
- Rbar/d2 when n = 1.
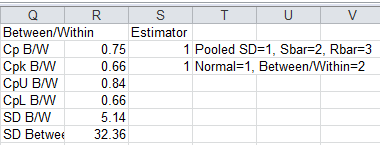
Users can change the sigma estimator calculation after they have run a histogram by changing the estimator fields in cells S2 and S3 on the far right of the histogram data sheet.
In addition between changing from Pooled Standard deviation to Sbar or Rbar, users can also choose Between/Within Deviation.
Note: Minitab started using Pooled Standard Deviation to calculate Cp/Cpk, and control limits on XbarR and XbarS charts in versions 15 and 16. Minitab 17 went back to Rbar/d2 and Sbar/c4 for XbarR/S control limits, but retained pooled stdev for Cp/Cpk calculations when using multiple samples.
USL & LSL = Nominal Value (+)(-) Tolerance
To calculate your Upper and Lower Specification Limits, provide your Nominal Value (+)(-) Tolerance (USL = Nominal Value + Tolerance, LSL = Nominal Value - Tolerance).
Once you have inputted your USL & LSL into the template, input your data - your Process Capability Metrics will then start calculating automatically (a minimum of 2 data values are required).
One-Sided or Unilateral Specification Limits
Use CpU (USL) or CpL (LSL) for Cpk.
Pp and Ppk Calculations in Weibull Histogram
Unlike the Pp and Ppk calculations which rely on a Normal distribution, the Weibull histogram uses the WEIBULL (or WEIBULL.DIST) function to calculate the Z-scores for the USL/LSL and from these it calculates Pp and Ppk. There is no Cp or Cpk calculation possible in the Weibull Histogram.
Pp = (PpU + PpL) / 2
Ppk = Min (PpU, PpL)
PpU = NORMSINV (WEIBULL (USL, Shape, Scale, TRUE))
PpL = NORMSINV (WEIBULL (LSL, Shape, Scale, TRUE))
If there is only a USL or LSL, the Weibull histogram Ppk is either PpU or PpL.

QI Macros Tools that Calculate Cp, Cpk and Pp, Ppk
- Histogram - calculates Cp, Cpk, Pp, Ppk and 20 other metrics using your data and spec limits.
- Weibull Histogram - calculates Pp, Ppk and other metrics using your data and spec limits.
- Capability Suite - creates six charts including histogram, control charts, probability plot, values plot and capability plot. Also calculates Cp, Cpk and Pp, Ppk.
- Cp Cpk Template - calculates Cp, Cpk and Pp, Ppk on multiple sets of data.
Stop Struggling with Cp Cpk Formulas!
Start creating your Cp Cpk Formulas in just minutes.
Download a free 30-day trial. Get Cp Cpk Formulas now!
QI Macros Draws These Charts Too!
