Need to do Binomial Capability Analysis But Don't Know How?
QI Macros will do the calculations and analysis for you right in Excel!
A Binomial test only has two outcomes: defective or non-defective.
Listen to our Binomial Capability Analysis podcast below!
* Generated using QI Macros' source material via an AI model *
Example of the QI Macros Binomial Capability Template
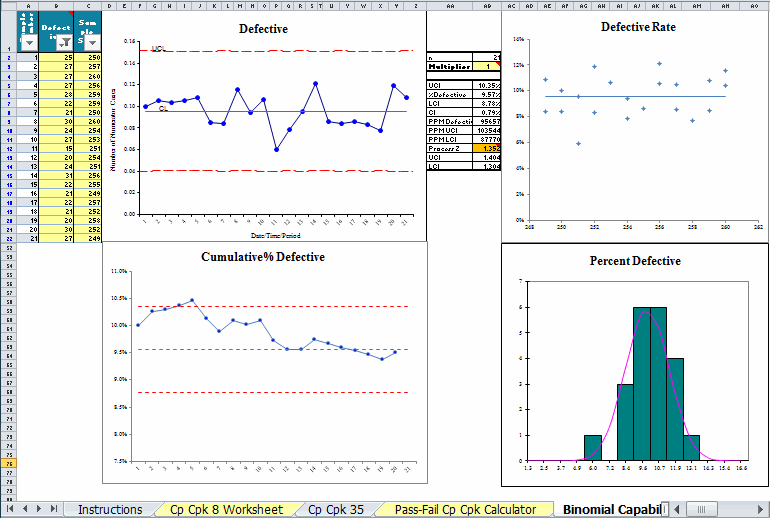
The Binomial Capability Template Consists of these Charts and Calculations:
- p chart of fraction defective to determine if the process is stable or not.
- chart of cumulative % defective
- the defective rate chart to determine if your data is binomial.
- the percent defective chart
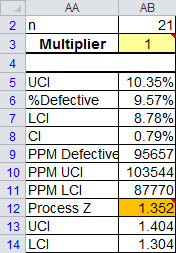
- Process Z measures the capability of your process. The desired level is 2 or greater. For any value less than 2, cell AB12 will turn orange to indicate lack of capability.
Tip: If your data is unstable and/or does not follow the Binomial Distribution, the calculated results may not be reliable.
Example of Binomial Analysis Using the Output Shown Above
- The p chart is in control so capability analysis is possible. (Out of control data, as mentioned above, is not recommended)
- The Cumulative % Defective chart is also pretty stable.
- The Defective Rate chart shows points evenly distributed on either side of the average, so distribution is Binomial.
- The Process Z score is 1.352. Since it is less than 2, the template flags it with orange to indicate the lack of capability.
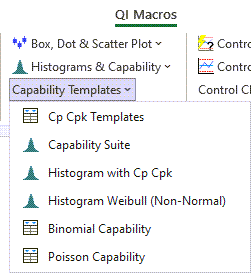
You can find this template by selecting QI Macros menu > Capability Templates > Binomial Capability.
Stop Struggling with Binomial Capability Metrics!
Start creating your Binomial Capability Metrics in just minutes.
Download a free 30-day trial. Get Binomial Capability Metrics now!
QI Macros Draws These Charts Too!
