Looking for an Excel Template to Perform Weibull Analysis?
QI Macros has a ready made Weibull analysis template for you!
Use Weibull Analysis to Analyze Failure Rates
Weibull Analysis is especially suited to failure rates (e.g., how long does a TV, PC, ball bearing, etc. operate before failing).
How to Conduct Weibull Analysis Using QI Macros Template
- Just select your failure data and sort it.
- Open QI Macros Weibull Analysis template by clicking on QI Macros Menu > Capability Templates > Histogram with Cp and Cpk. Once the Histogram template is open, click on the Histogram Weibull worksheet.
- Paste your sorted data into column B of the Weibull worksheet - it will create a histogram, and calculate the Weibull and process capability metrics for you.
- Next, click on "Solve for Slope" to get best fit using Maximum Likelihood Estimation (MLE). You can also solve for Location if the probability plot tails downward.

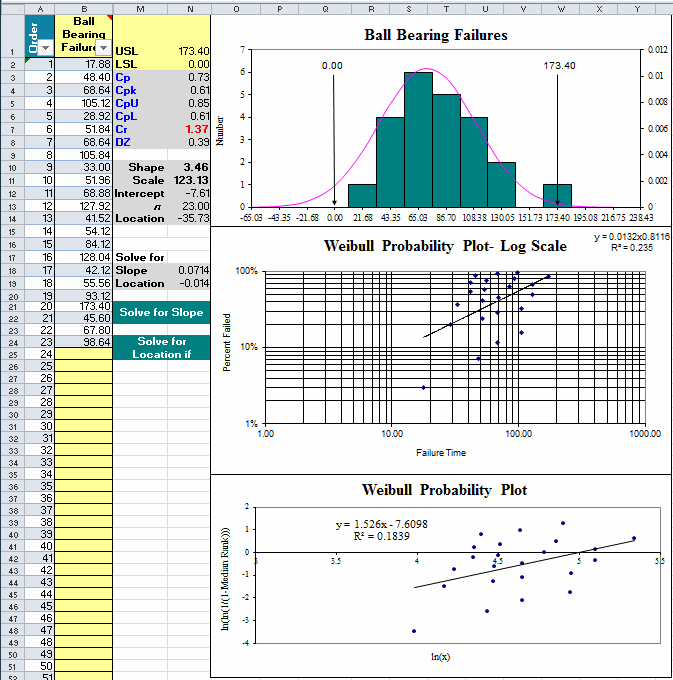
In this example of Ball Bearing failure rates, rates peak at 81.86.
How to Conduct Weibull Analysis with Censored Data
Some failure tests either 1.) end before all parts have failed (singly-censored) or 2.) continue with parts being removed from the test before they fail (multiply-censored).
- Just select your failure data and sort it. Also sort the censored data.
- Open QI Macros Weibull Analysis template by clicking on QI Macros Menu > Capability Templates > Histogram with Cp and Cpk. Once the Histogram template is open, click on the Weibull Single-Censored or Multiply-Censored worksheet.
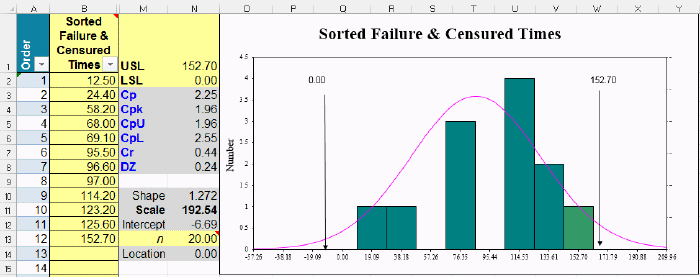
- Paste your sorted data into column B of the worksheet - it will create a histogram and calculate Weibull and process capability metrics for you.
- Singly-Censoring means that there were failures before or after the test was started. In this example, there were eight more test items still working after the test was stopped at 152.70. To calculate correctly, simply input the sample size (20) in Cell N13.
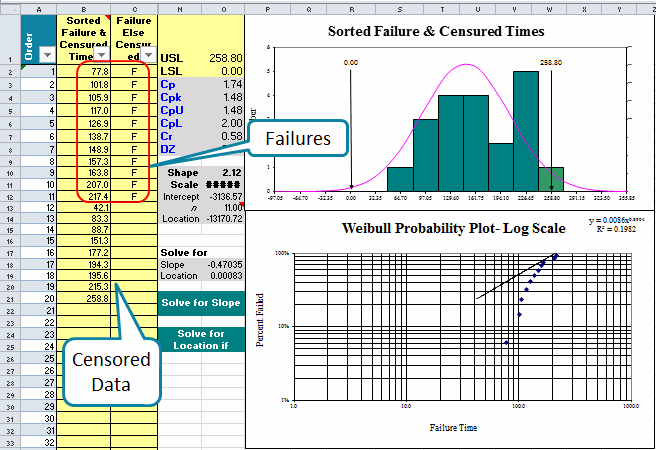
- Multiply Censored data contains both failures and parts that were removed from the test without failing.
- Sort the failures and enter those first with an "F" for failure in column C.
- Sort the censored data and enter them after the failures with a blank cell in Column C.
- Click on "Solve for Slope" to get best fit using Maximum Likelihood Estimation (MLE).
- You can also solve for Location if needed.
Note: Right-Censored Data is also known as Suspended data. This refers to failures that are observed only if they happen before a specific time and that some units have failed, while some units remain operational. Left-Censored Data is also known Interval data. This refers to observed unit(s) that have failed, but you’re not exactly sure WHEN they failed.
Stop Struggling with Weibull Histograms!
Start creating your Weibull Histograms in just minutes.
Download a free 30-day trial. Get Weibull Histograms now!
QI Macros Draws These Charts Too!
