Want to Perform a Monte Carlo Simulation in Excel?
Follow this Monte Carlo Example using Excel and QI Macros
This example combines Excel's Random Number Generator with QI Macros Histogram to Predict Performance.
At ASQ WCQI 2022, Stephanie Parker gave an excellent presentation on how to do Monte Carlo simulation using a case study about glass, involving the thickness of the glass and the height of a bushing. I'm going to use Excel and QI Macros to recreate what she covered.
First, install Excel's Data Analysis Toolpak
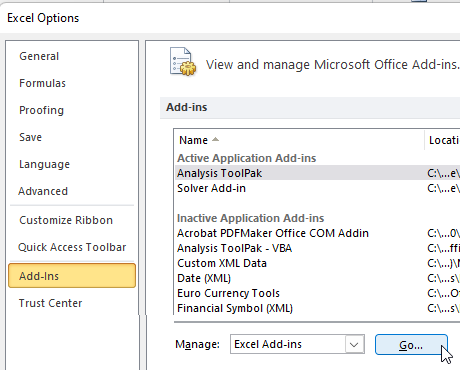
- Click on File -> Options -> Add-Ins -> Excel Add-ins -> Go:
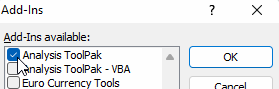
- Select Analysis Toolpak:
Next, determine what inputs are required and the formula to describe Y = f(x)
In this example, panes of glass are attached using clamps through machined holes protected by bushings.
- x1 = thickness of the glass
- x2 = height of the bushing
- Y = f(x) = x1-x2
In this case, both x1 and x2 are normally distributed. Other distributions can be used.
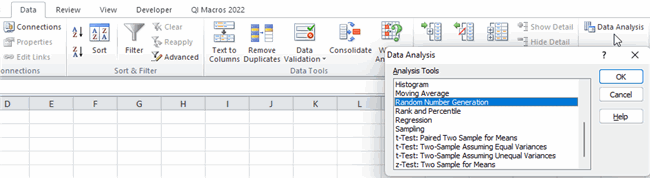
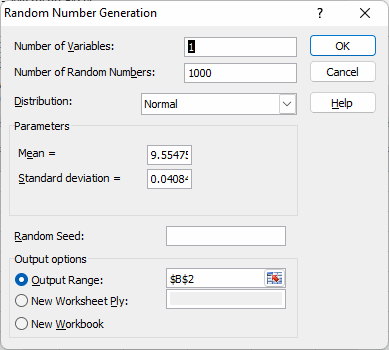
Use Excel's Data Analysis Toolpak to generate random numbers for each x. Starting mean and standard deviation can be estimated from a number of samples (glass and bushing). Recommended number of data points, a minimum of 1,000.- On a blank Excel worksheet, choose Data -> Data Analysis -> Random Number Generator:
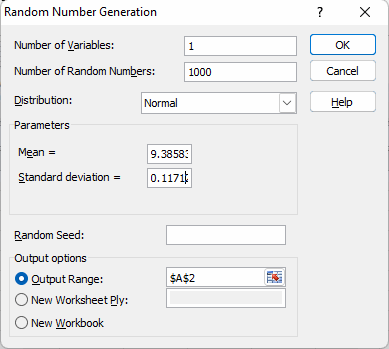
- Generate 1,000 points for Glass using estimated mean and standard deviation shown below:
- Repeat for Bushing Height:
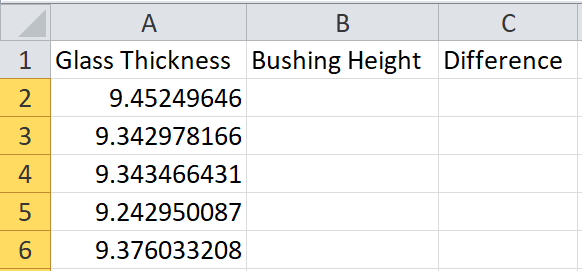
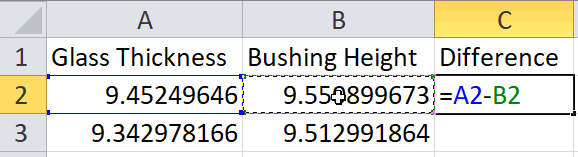
- Add a formula for the difference and extend the calculations in Column C down to Row 1,001:
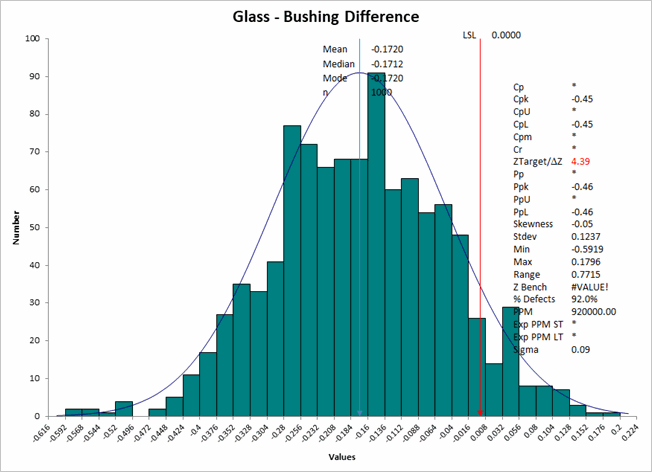
- Select the Difference column data and run a QI Macros Histogram with LSL = 0 and no USL:
- As you can see, Cpk = -0.45, so this is not capable of meeting customer requirements. So, the team had to figure out how to adjust the bushing height. Using 3-D printed bushings, they ran 30 more samples to get a baseline mean and standard deviation. Then, they re-ran the Monte Carlo simulation:
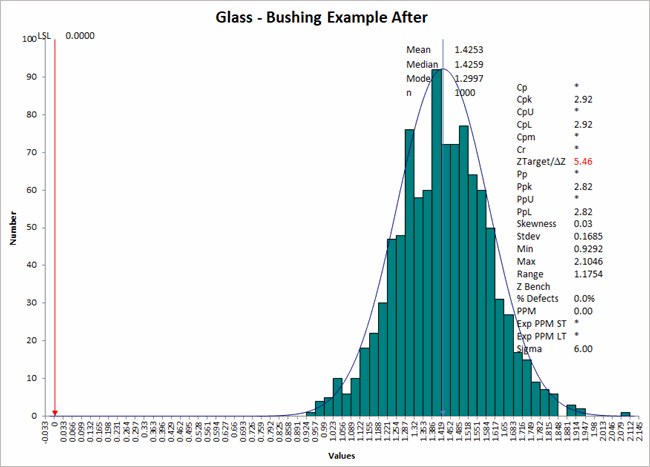
The change pushed Cpk over 2.0 (Six Sigma).
This has been a simple example of Monte Carlo Simulation using Excel's Random Number Generator and QI Macros' Histogram.
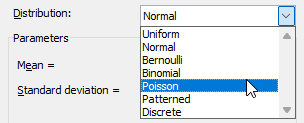
Another example might be cycle time on an assembly line that combines the cycle time for each machine or process (Y = x1 +x2 +x3). Or we could simulate arrivals at a hospital ER using a Poisson distribution. NOTE: There are several Key Distributions available in Excel's Random Number Generator:
QI Macros Draws Histograms and These Charts Too!
