Need a Cp Cpk True Position Template for Excel?
QI Macros has a ready made true position template for you!
What is True Position?
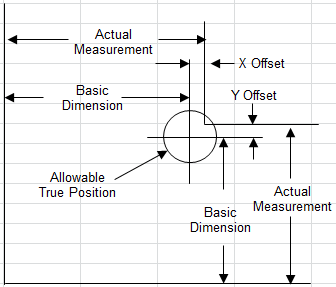
If you are drilling a hole which has an X and Y location, you have to be able to measure Cp and Cpk for both the X and Y dimensions as well as the overall location of the hole:
How to Use the True Position Template to Calculate Cp Cpk
- Open the template by clicking on QI Macros menu > Capability Templates > Cp Cpk Templates:
-
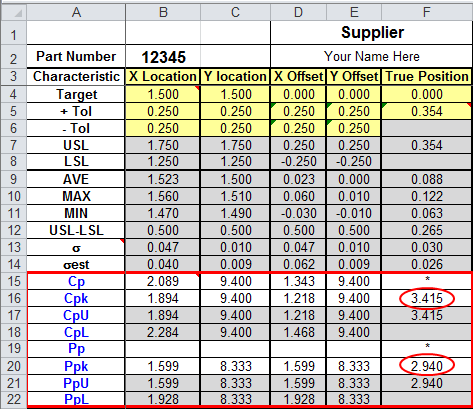
The template has several tabs, select the Cp Cpk True Position worksheet:

- Input your target and tolerances for the X and Y coordinates.
Also input the allowable offset for X and Y.
The target for the offset (D4:E4) is usually zero:
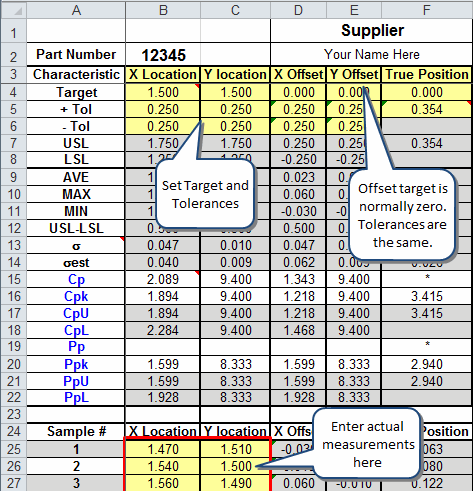
- Enter actual measurements starting in cells B25 and C25 as shown.
- Evaluate Cp and Cpk for the X and Y location as well as the Cpk for the True Position:
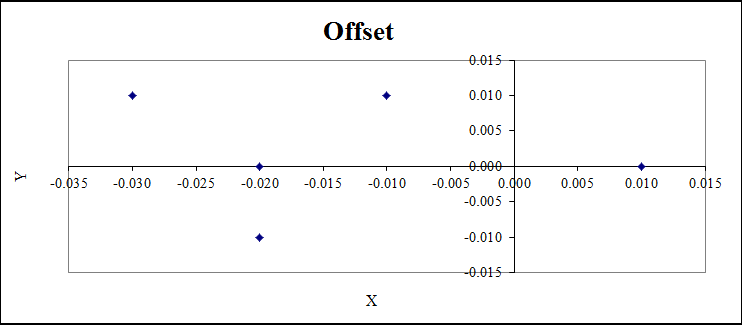
- Also review the true position chart for any patterns:
Note: Tolerance is 1/2 the diameter of allowable true position. There is no LSL.
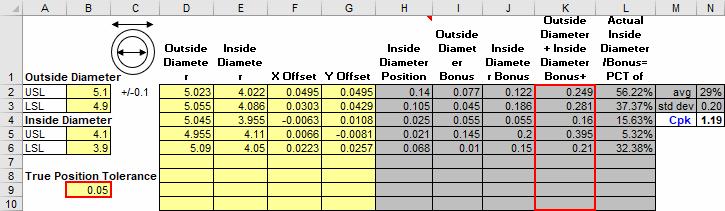
Maximum Material Condition (MMC) Cpk
If you have a cylinder with an inside and an outside diameter, you can determine Cpk using the MMC template. The X and Y offsets are optional. You just need measurements of the outside and inside diameters to calculate Cpk (N4).
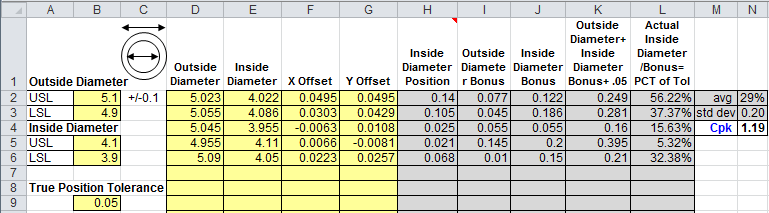
Bonus Tolerance
QI Macros calculates individual Bonus Tolerances for each part that is measured (Outside/Inside Diameter and X/Y Offsets) in the MMC Cpk True Position template. These tolerance values are located in column K and are calculated by using the True Position Tolerance value found in cell B9.
Stop Struggling with Cp Cpk metrics!
Start creating your Cp Cpk metrics in just minutes.
Download a free 30-day trial. Get Cp Cpk metrics now!
QI Macros Draws These Charts Too!
