Not sure which chart is best for your data?
QI Macros Chart Wizard can choose the right chart for you.
Create Key Statistics Using QI Macros
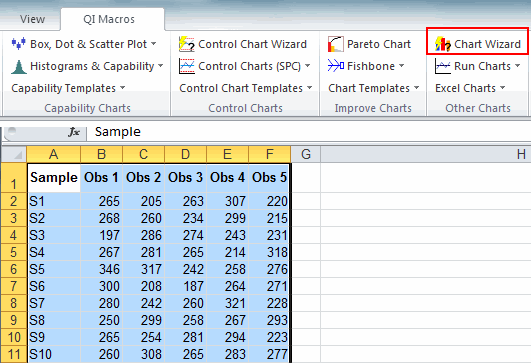
- Select your Data
- Click on QI Macros Menu > Chart Wizard
- QI Macros will analyze your data and generate all of the most likely charts for your data.
Why It Matters: Getting the right chart simplifies and accelerates analysis.
- Confused About Which Chart to Choose?
- Still Can't Figure It Out Even After Attending a Class?
- Trying to Use a Decision Tree like the ones in Minitab®?
Training isn't enough! Based on calls from our tech support line, we can tell you that most folks struggle with which chart to choose. Even if they have gone to a training class, it doesn't matter, they still spend time they don't have trying to decide on the right chart and then they still aren't sure.
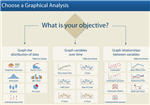
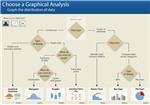
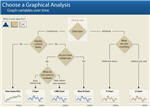
Decision Trees are Cumbersome. Rather than having to think your way through a forest of decision trees like the ones in Minitab®, wouldn't it be great if the decision tree was already coded into the software? In QI Macros, it is!
| Minitab® A Forest of Decision Trees |
QI Macros Turns Decision Trees into a One Click Chart Wizard |
|---|---|
 |
|
 |
|
 |
QI Macros Chart Wizard will analyze your data and choose the right charts for you. It saves you time and mistake proofs the chart selection process. Spend your time on more important things like analyzing the charts after they are drawn.
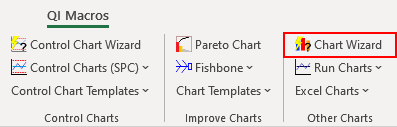
Go Deeper: To use the QI Macros Chart Wizard:
- Just click and drag over your data to select it.
- Then click on the Chart Wizard from the QI Macros menu:
- The Chart Wizard will run descriptive statistics and draw the most probable charts.
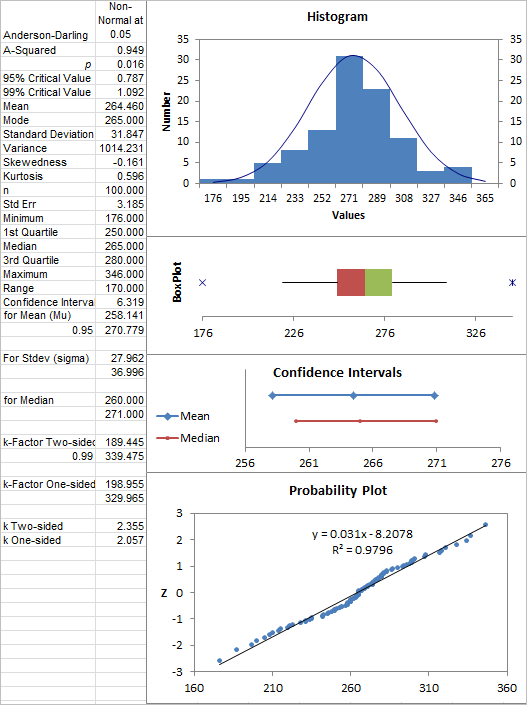
Descriptive Statistics:
Histogram, Box Plot, Confidence Intervals, Normal Probability Plot
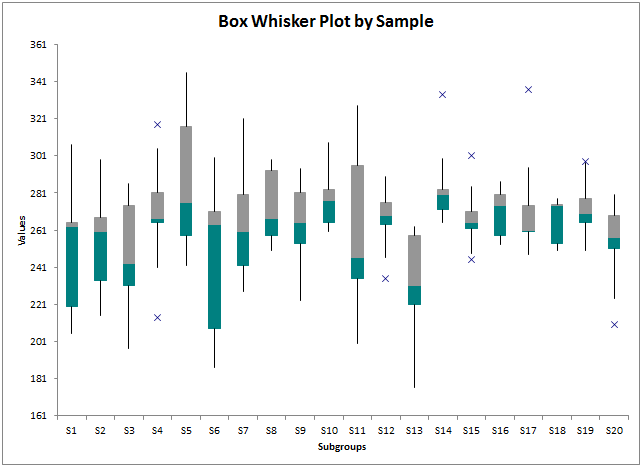
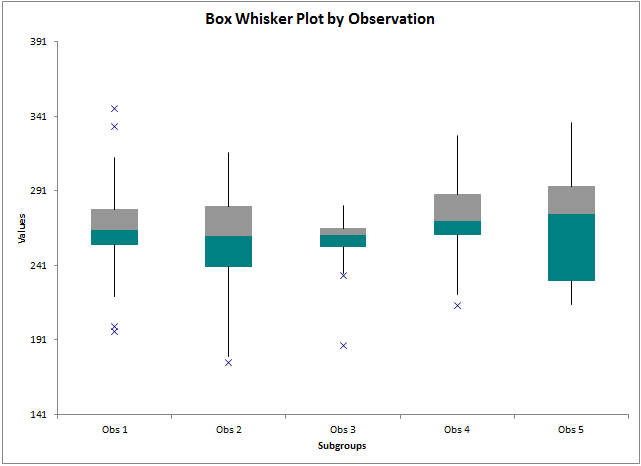
Box and Whisker Plots
By Sample (data rows)
By Obs (columns)
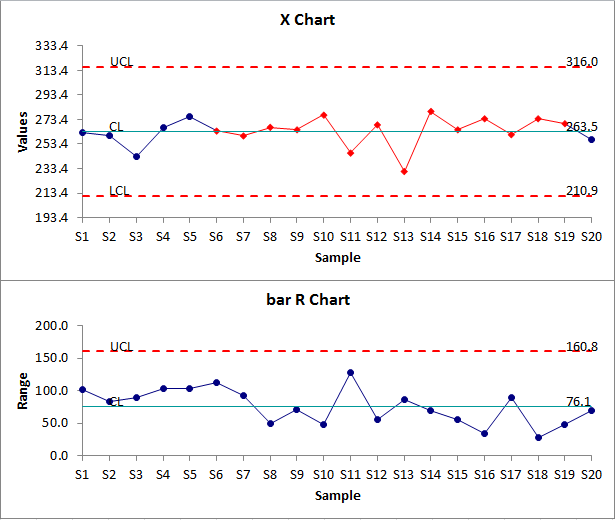
XMedianR Control Chart
Here's how QI Macros Chart Wizard selects which charts to draw:
| Columns of Data | 1 | 2 | 3-9 | 10+ | |
|---|---|---|---|---|---|
| Integers or Decimals | If Max > 10*Min and Row headings not dates Pareto Chart |
||||
| Integers | c Chart | if Numerator/ Denominator p and u Chart Scatter if Denominator is constant np Chart |
|||
| Integers or Decimal | Descriptive Statistics includes histogram, normal probability plot, boxplot and confidence intervals |
||||
| Box & Whisker by Row and Column |
|||||
| Normal | XmR Chart | XbarR Chart | XbarS Chart |
||
| Non-Normal | XmR Median Chart | XMedianR Chart | XbarS Chart | ||
Learn More...
- Select the right control chart using the Control Chart Wizard
- Jump start your improvement project using the Improvement Project Wizard
- Select the right statistical test using the Statistics Wizard
