Want to Make a Stock Chart in Excel?
Stock Charts are Used to Track Fluctuations in Data
Stock Charts get their name from the Stock Market as they are most often used to track stock prices. However, they can be used to analyze many different types of data such as temperatures, machine output, weight, etc.
How to Create Stock Charts in Excel
To create a stock chart in Excel, select your data, then click on the Insert tab, Other Charts and then Stock. There are four different stock charts to choose from. They require your data columns to be in the order shown below:
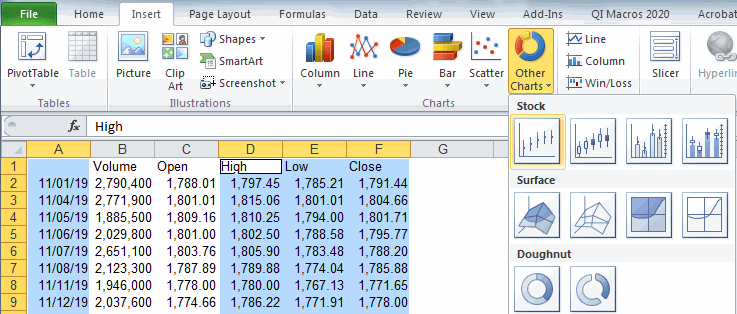
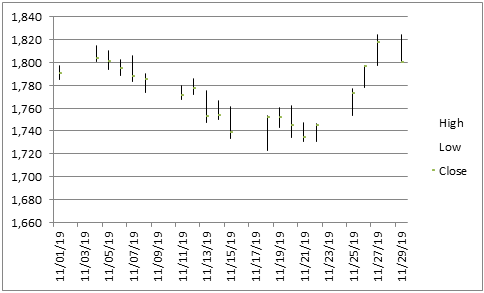
High Low Close
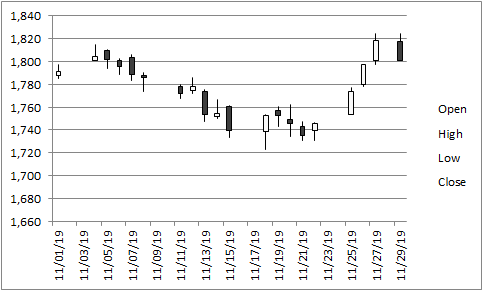
Open High Low Close (OHLC)
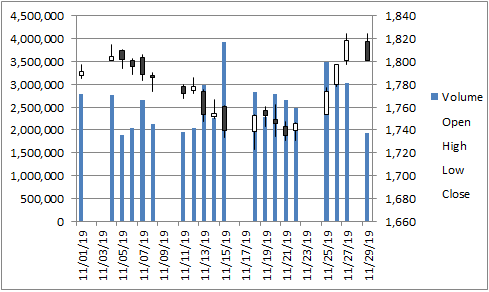
Volume High Low Close
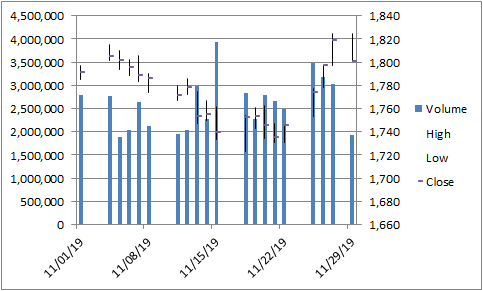
Volume Open High Low Close (VOHLC)
Consider These Other Charts to Show Data Fluctuation and Variation
Stock charts can be difficult to read, especially those that show the volume on a secondary axis. Here are some other options.
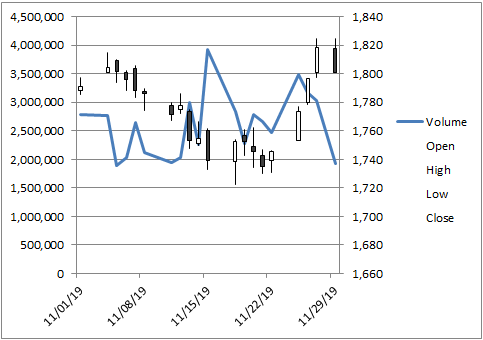
Stock Chart Using Line vs Columns
Right click on one of the columns in the VOHLC chart and change the volume series chart type to line chart.
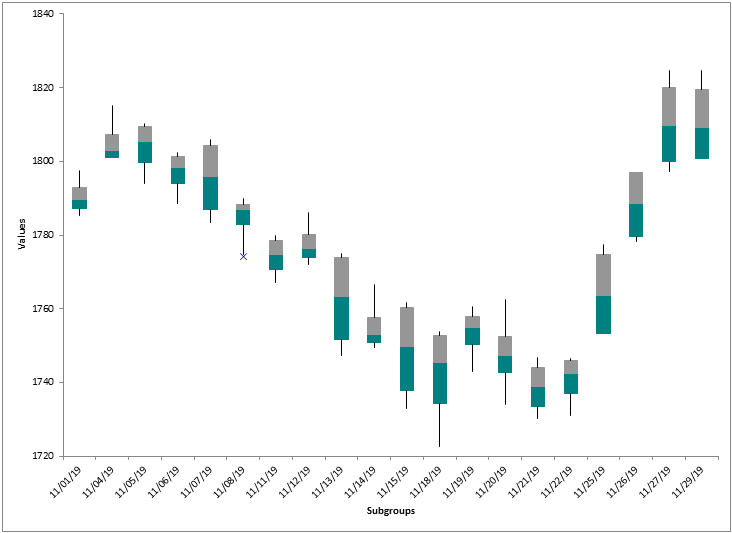
Box and Whisker Plot
Similar to the Open High Low Close Stock Chart, the Box Plot shows Outliers using "X" and shades the box to show the median.
QI Macros Add-in for Excel Makes it Easy to Create All of These Charts
While its possible to create stock charts in Excel, its extremely complicated and time consuming to create a Box and Whisker Plot. Save yourself time and headaches by using QI Macros. Download a 30 day trial and try it now.
Stop using old technology!
Upgrade Your Excel and Data Analysis Skills to Smart Charts Using QI Macros.
Track Data Over Time
Line Graph
Control Chart
Compare Categories
Pie Chart
Pareto Chart
Analyze Variation
Bar or Column Chart
Histogram
