Need to Make a Radar-Spider Chart in Excel?
QI Macros can help you draw more than simple Radar-Spider charts!
Use Radar-Spider Charts When Categories are Not Directly Comparable
For example, sales of various product lines throughout the year or comparing products of two vendors using a list of various features. Radar charts plot data on an axis that starts at the center and ends on an outer ring.
Create Radar - Spider Charts using QI Macros
- Select your data.
- Click on QI Macros menu > Excel charts > Radar Spider Chart.
- QI Macros will do the math and analysis for you.
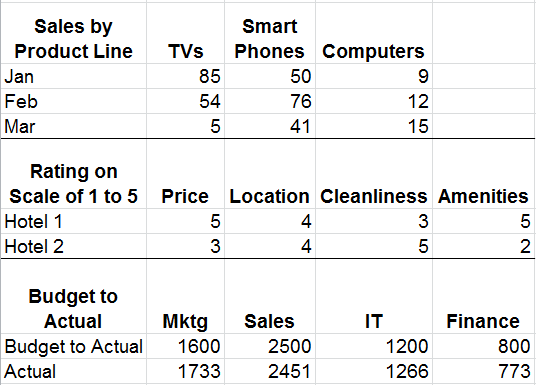
Example of a Radar - Spider Chart in Excel

Radar Chart Data Examples
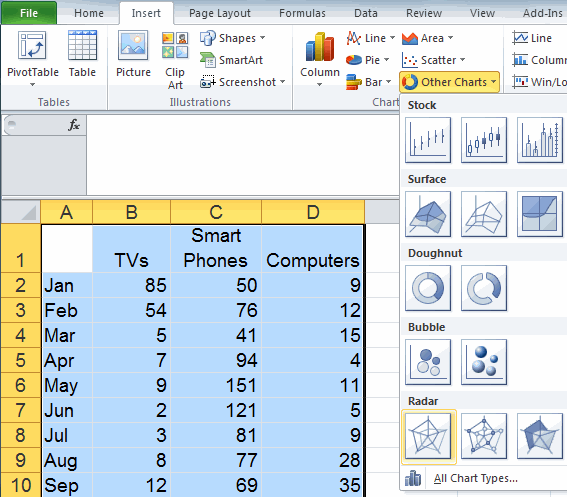
How to Create a Radar Chart in Excel
To create a radar or spider chart in Excel, select your data, then click on the Insert tab, Other Charts, then Radar.
Consider a Pareto Chart Instead of a Radar Chart
Radar charts are seldom used because they are hard to read and interpret. For most data sets a Pareto chart is a better choice and its easy to create Pareto charts using QI Macros.
Stop using old technology!
Upgrade Your Excel and Data Analysis Skills to Smart Charts Using QI Macros.
Track Data Over Time
Primitive Chart
Line Graph
Line Graph
Smart Chart
Control Chart
Control Chart
Compare Categories
Primitive Chart
Pie Chart
Pie Chart
Smart Chart

Pareto Chart
Pareto Chart
Analyze Variation
Primitive Chart
Bar or Column Chart
Bar or Column Chart
Smart Chart
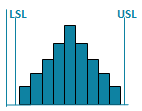
Histogram
Histogram
