Do You Struggle Running Charts in Excel?
QI Macros add-in makes it easy to create charts in Excel
While Excel creates basic charts, the multi-step process takes a long time and the resulting chart is often hard to read, suffering from what Edward Tufte calls "Chartjunk." We believe that charting software should do as much of the work as possible. That’s why we created QI Macros for Excel — a shortcut to Excel Charts.
QI Macros also draws more advanced charts not found in native Excel
These advanced charts, or smart charts, as we like to call them actually make calculations and do some data analysis for you. Here are some examples:
| Type of Analysis | Primitive Chart |
Better Chart |
Smart Chart |
|---|---|---|---|
| Evaluate Over Time |
Line Graph |
|
|
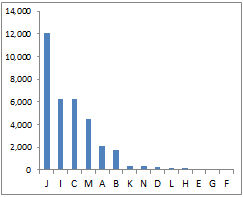
| Compare Categories |
Bar Chart |
Descending Bar Chart |
|
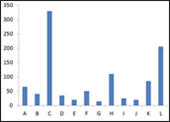
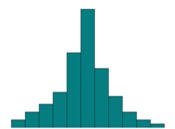
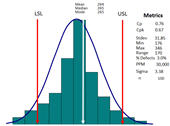
| Analyze Variation |
Bar Chart |
|
Histogram with Bell Curve and Process Capability Analysis |
QI Macros is Compatible with Excel 2021/2024/Office 365 (PC) | 2021/2024/Office 365 (Mac)
Stop using old technology!
Upgrade Your Excel and Data Analysis Skills to Smart Charts Using QI Macros.
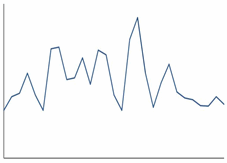
Track Data Over Time
Primitive Chart
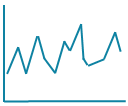
Line Graph
Line Graph
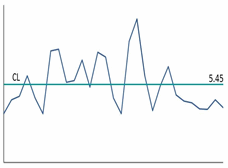
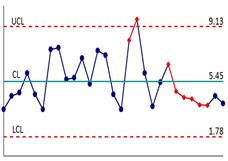
Smart Chart
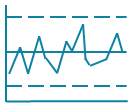
Control Chart
Control Chart
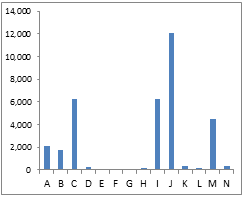
Compare Categories
Primitive Chart
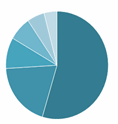
Pie Chart
Pie Chart
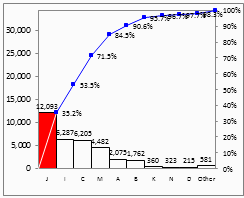
Smart Chart

Pareto Chart
Pareto Chart
Analyze Variation
Primitive Chart
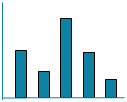
Bar or Column Chart
Bar or Column Chart
Smart Chart
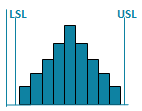
Histogram
Histogram
