Using Excel Formulas
Some users of the QI Macros miss the opportunity to use Excel's formulas to prepare the data for charting or analysis. QI Macros Excel Formulas Template provides an excellent starting point for many useful formulas. You can find it under Templates for Lean Six Sigma > Calculators > Excel Formulas. There are several types of formulas in the template: Time, Text, Average/Count/Sum, Lookup, Pass/Fail, Healthcare, and Finding Bad Data Formulas.
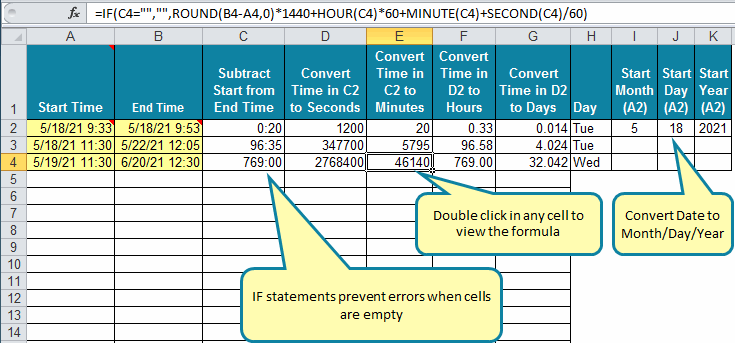
Time Formulas
Excel stores dates and times as a number (e.g., 41670.4270833333 is January 31, 2014 10:15). Sometimes you can use this number and other times you might want to convert it to minutes, hours, or days. Or you might want to convert month, day and year into this date format. The Time Formulas sheet has formulas for each of these calculations.
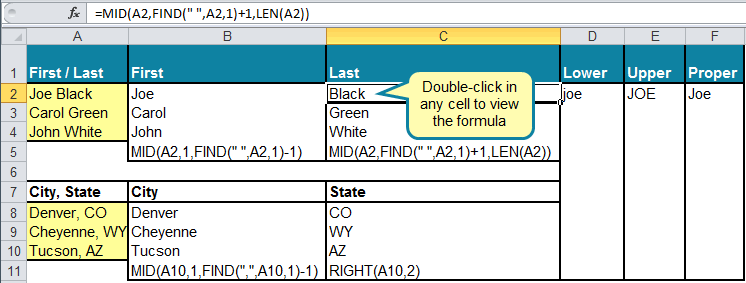
Text Formulas
Let's use Excel's functions to split a cell containing a first and last name into two cells. Simply, click on the cell next to the full name and insert a text function. It took me a while to find this function (MID):
: 
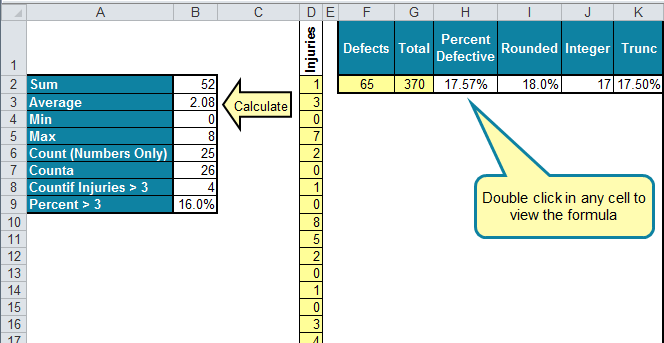
Average, Count, Sum Formulas
Sometimes you just need to average, count or sum data:
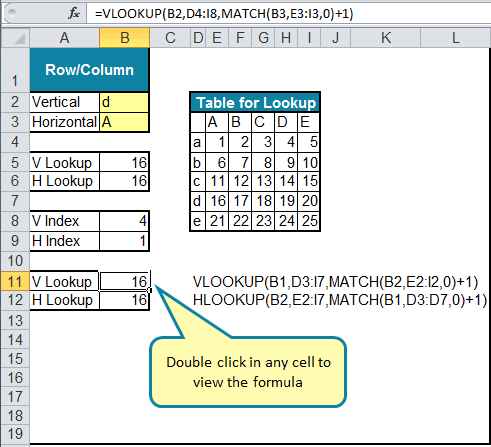
Horizontal and Vertical Lookup Formulas
Sometimes you lookup data within a table either vertically or horizontally:
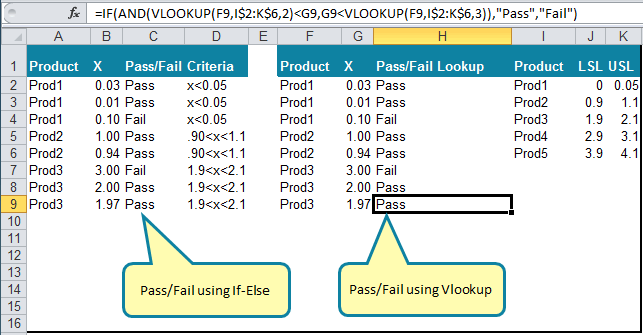
Pass/Fail Formulas
Sometimes you need to evaluate data to determine if it passes or fails:
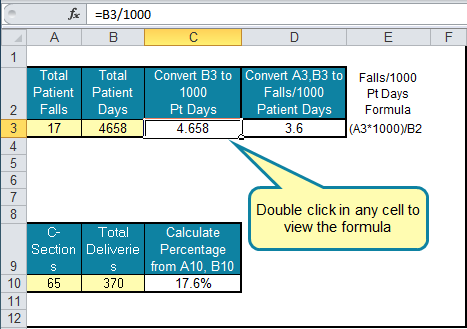
Healthcare Formulas
Healthcare needs to calculate errors/1000 patient days and many others:
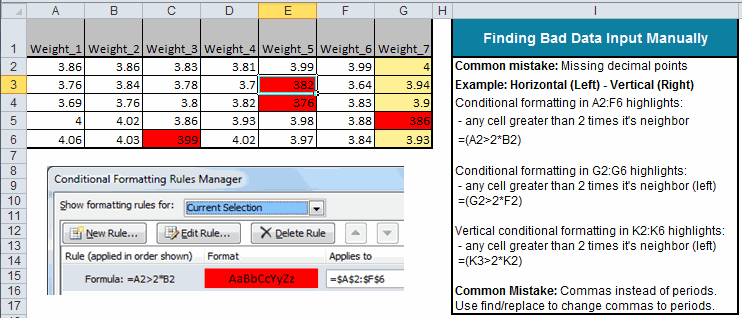
Finding Bad Data using Conditional Formatting
The most common mistake when entering data manually is a missing decimal point. The conditional formatting formula below checks to see if a cell's value is more than two times its neighbor and highlights it in red. In this example, 382 is greater than 2*3.64 so the data is highlighted. The formatting in column G needs a slightly different formula.
Here's My Point
Sometimes data has to be manipulated to provide the right starting point for analysis. Sometimes you need a simple mathematical formula, sometimes text, sometimes IF-THEN-ELSE logic. Regardless, sometimes you will need a basic grasp of Excel formulas and functions to make your life easier. And the QI Macros Excel-Formulas template will get you started.
Most Popular Charts Included in QI Macros for Excel
