Need to Create a Tree Diagram in Excel?
QI Macros has Several Ready-Made Tree Diagram Templates!
Why it Matters: Use a tree diagram to systematically link ideas, targets, objectives, goals, or activities in greater and greater detail.
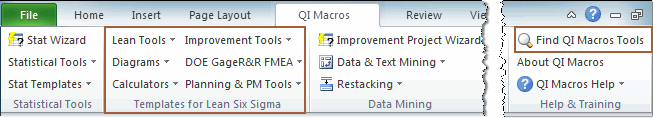
NOTE: All templates listed below can be found in Lean Tools > "CTQ Tree | Decision Tree | Driver Diagram"
QI Macros Tree Diagram Examples
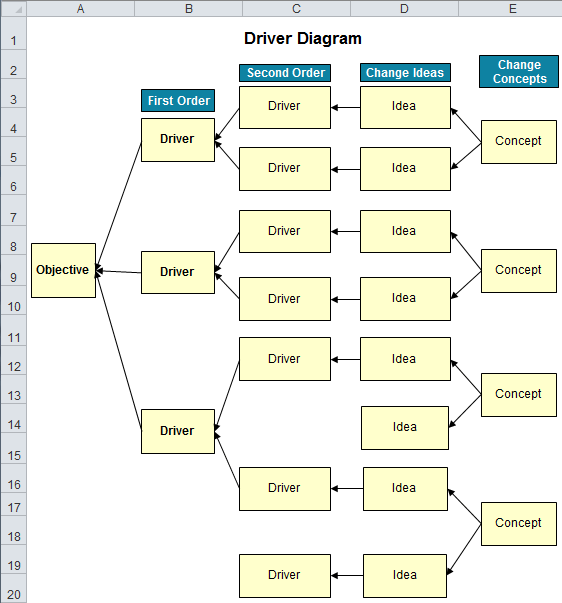
Driver Diagram
Used as a theoretical representation of what contributes to the success of a project. It shows the overall relationship, along with subsets of "drivers" that directly contribute to the success of the project or goal:
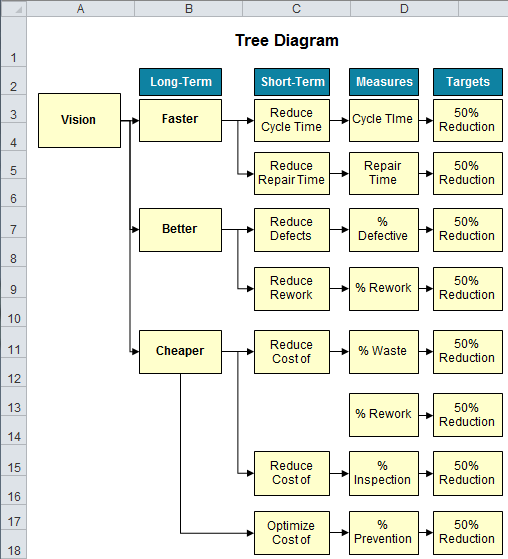
Tree Diagram
Use a tree diagram to map specific tasks to primary and secondary goals. It maps the methods required to achieve corporate goals. The tree diagram shows the key goals, their sub-goals, and key tasks. It can help identify the sequence of tasks or functions required to accomplish an objective.
The tree diagram can help translate customer desires into product characteristics. It can also be used like an Ishikawa diagram to uncover the causes of a particular problem:
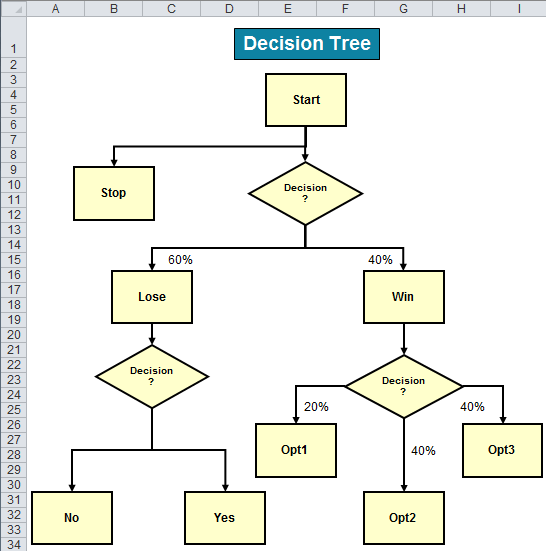
Decision Tree
A visual and analytical decision support tool, a Decision Tree is similar to a Flow Chart and includes specific "nodes." In this case, your "Decision Nodes" are represented by squares, while "Chance Nodes" are represented by diamonds.
Complete your Decision Tree accordingly:
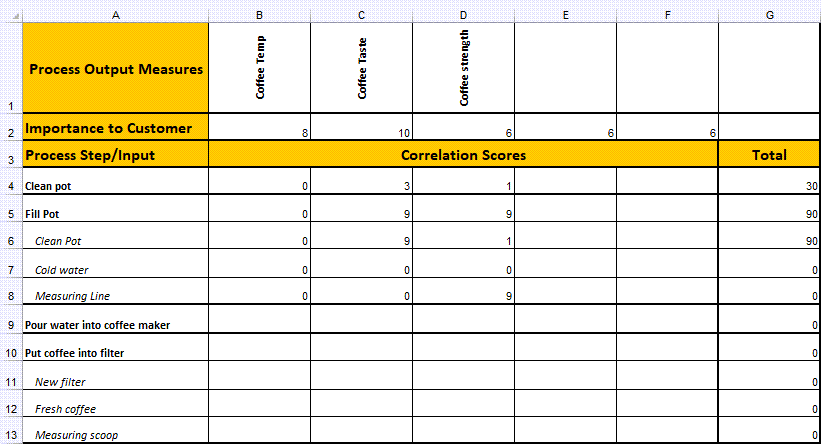
Driver Matrix
The Driver Matrix template uses correlation scores that contribute to a cumulative sum total. This matrix shows the overall relationship of each Process Step/Input with the Process Output Measures.
NOTE: The Project Output Measures are assigned a numerical value (1-10) of how important they are to the customer.
To create a Tree Diagram
- Develop a clear statement of the problem, issue, or objective to be addressed. Place it on the left side of a board, wall, or easel and work toward the right.
- Brainstorm all of the sub-goals, tasks, or criteria necessary to accomplish or resolve the issue.
- Repeat this process using each of the sub-goals until only actionable tasks or elements remain.
- Check the logic of the diagram in the same way as the Ishikawa: Start at the right and work your way back to the left by asking: If we do this, will it lead to the accomplishment of the previous task?
Other Tree Diagrams in QI Macros
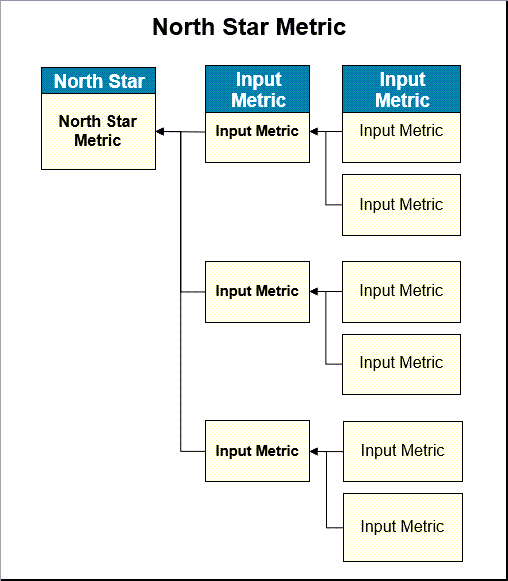
Want to create a North Star Metric?
You can custom-create one by updating the CTQ Tree Diagram template!
To do so, make sure to have 3 columns of data that represent:
- Product Initiatives
- Key Performance Indicators (KPIs)
- Dimension
And then make sure the end of each column points to a singular box - this is your "North Star":
Haven't you waited long enough?
Start creating your Tree Diagram in just minutes.
Download a free 30-day trial. Get the Tree Diagram now!
The Tree Diagram is one of many tools included in QI Macros add-in for Excel.
QI Macros adds a new tab to Excel's menu, making it easy to find any tool you need. If you can't locate a tool, use the find tools feature on the far right side of QI Macros menu.