Want to Create a Value Stream Map in Excel?
QI Macros VSM Templates Will Jump Start Your Efforts
Why Value Stream Maps Matter:
Value Stream Maps are a valuable tool for analyzing value-added and non-value-added activities and delays. However, they can be time-consuming and cumbersome to create.
That's why we created this automated VSM tool.
Automated Value Stream Map
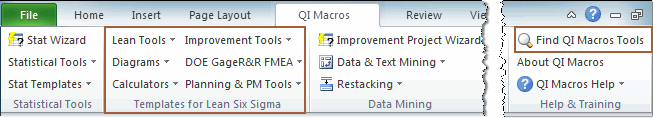
To access QI Macros Value Stream Mapping Template , click on the QI Macros Menu » Lean Tools » Value Stream Mapping:
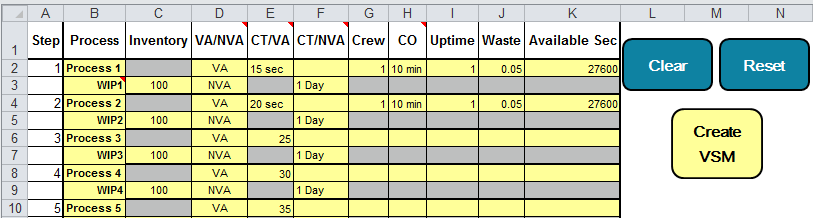
The template is pre-populated with values to give you an idea of what to input in each cell. Use the Clear button to delete the contents of each cell and the Reset button to re-populate the sample text.
Each step in a value stream map represents an operation that is performed on the product. The operation is generally performed in one location with a clear beginning and ending point. Value stream maps are broad in scope and are not meant to describe individual tasks like a flowchart.
For each step in the Value Stream Map:
- Briefly describe the Process or Work in Process (WIP) step in column B (e.g. Take Order, Paint Door, Measure Board).
NOTE: WIP is not plotted on the VSM output. Input your description in the Process cell, if you would like it to appear on your VSM output.
- Estimate the amount of Inventory on hand in each WIP area in column C
- Indicate if the step is Value Added or Non-Value Added from a customers standpoint in column D
- Input the Cycle Time for Value Added and Non-Value Added steps in columns E and F, respectively
- Input the number of people it takes to perform the process in column G
- Input Changeover Time (time from completion of step for one product to beginning of step for the next product) in column H
- Input % of Uptime in column I (percentage of time process is available)
- Input % of Waste or scrap in column J
- Input Available sec in column K (amount of time available, in seconds, within a shift or process)
Once you have populated all of the fields, click the Create VSM Button and QI Macros will draw a value stream map for you. Any rows with values will be shown on the Value Stream Map.
Tip: Adding and deleting items from the input matrix:
- Do not delete rows - leave cells blank instead of deleting the row.
- The Value Stream Map template has room for 108 steps - it is intended to include high-level steps/processes only. If you need to add more steps, you will need to copy and paste symbols onto the Value Stream Map output.
Remember to save your Value Stream Map as an .xlsm file to enable macro content.
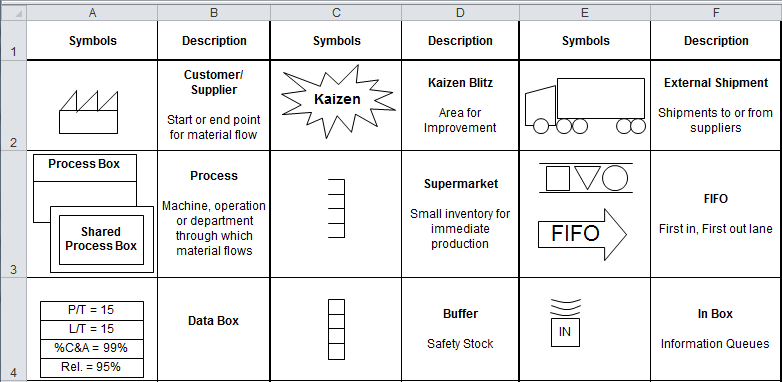
Value Stream Mapping Symbols and Icons
QI Macros VSM template has a Symbols worksheet with common VSM symbols and icons created just for you. Use copy and paste to add to your VSM.
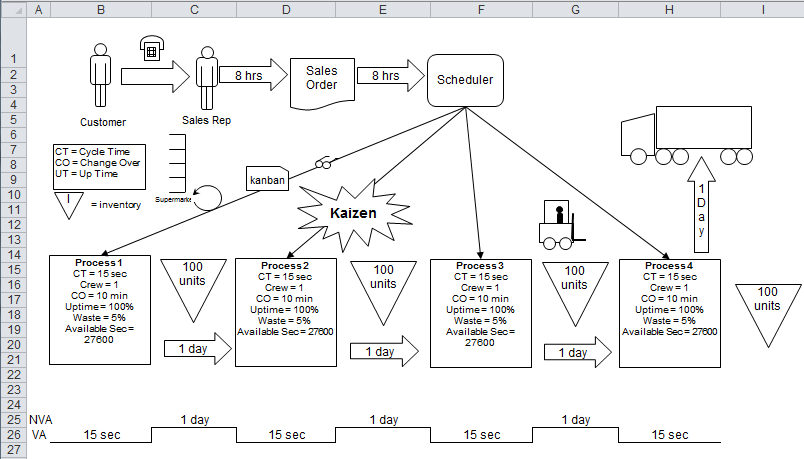
Value Stream Examples to edit
Open one of three examples and edit to create your own.
Click and drag, copy and paste, or use Excel's drawing symbols to create your own custom VSM.
There's even a hospital emergency room VSM Jay created with one of his clients.
Haven't you waited long enough?
Start creating your Value Stream Map in just minutes.
Download a free 30-day trial. Get the Value Stream Map now!
The Value Stream Map is one of many tools included in QI Macros add-in for Excel.
QI Macros adds a new tab to Excel's menu, making it easy to find any tool you need. If you can't locate a tool, use the find tools feature on the far right side of QI Macros menu.
Learn More...
Other Charts Included in QI Macros Add-in for Excel
