Uncertainty Template
Used to Measure Different Forms of Uncertainty
To open this template, click on the QI Macros menu > DOE Gage R&R FMEA > Uncertainty Template:

NOTE: This Worksheet is the intellectual Property of E=mc3 Solutions. Permission is granted to the E=mc3 Solution Clients who have validly purchased this spreadsheet or with a QI Macros Purchase. All others should contact: emc3solu@aol.com or call 330-328-4400 to purchase a license.
In the July 2026 version of QI Macros, there are (2) template options:

In the July 2024 version of QI Macros, there are (2) template options:

Prior to the July 2024 version of QI Macros, there were (2) template options:

Uncertainty 2026
Included in the 07.2026 version of QI Macros
To complete this worksheet:
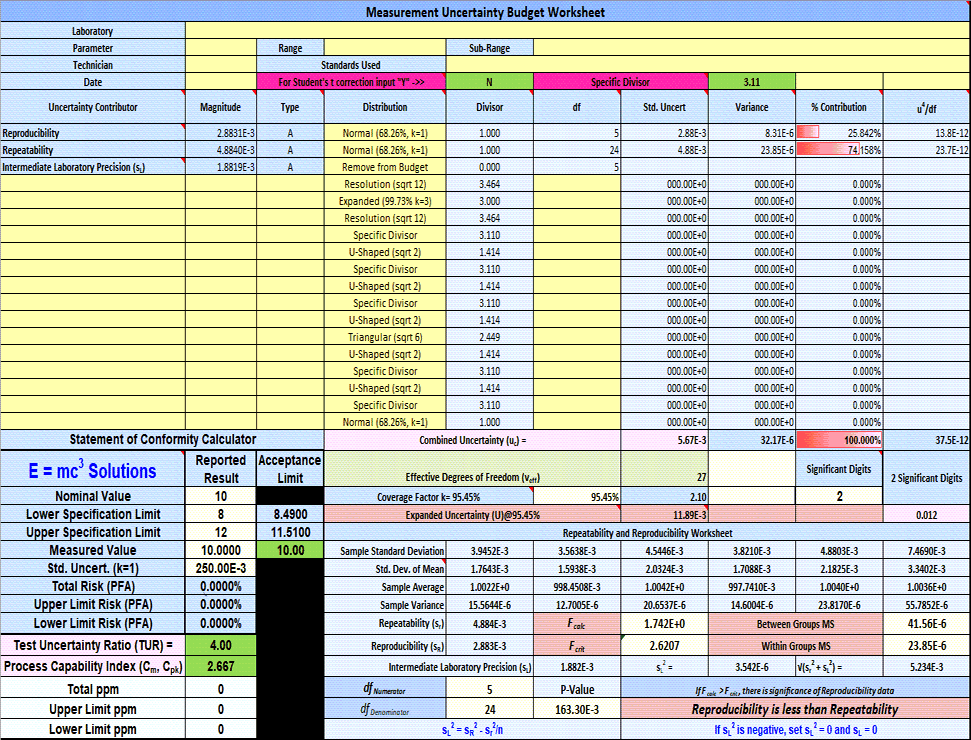
- Input your "Technicians" data in cells E42:J71.
- Once you have done so, your Uncertainty values will be calculated and filled in automatically!
Repeatability is located in cell E34, while Reproducibility is in cell E35.
Combined and Expanded Uncertainty are in cells G25 and G28, and Intermediate Laboratory is in F36. - Lastly, input your Type in Column C.
NOTE: You can change your "Distribution" definition in cells D7 through D24.
For additional questions regarding this template, contact E=mc3 Solution directly: 330-328-4400.
Uncertainty 2024
Included in the 07.2024 version of QI Macros
To complete this worksheet:
- Input your "Technicians" data in cells E23 to J42.
- Once you have done so, your Uncertainty values will be calculated and filled in automatically.
Repeatability in B7 and Reproducibility in B8
Combined and Expanded Uncertainty in G17 and G20 - You can change your "Distribution" definition in cells D7 through D16.
- Input "Traceable Uncertainty of the Standard" in cells A9:B9, "Resolution of the Standard" in A10:B10 and "Resolution of UUT" in B11:B11. Lastly, input your Type in column C and Distribution definition in column D:
- Your data set will be placed into the following bar chart:


For additional questions regarding this template, contact E=mc3 Solution directly: 330-328-4400.
Decision Risk Template
Included in the 07.2026 version of QI Macros
To complete this worksheet:
- Input Sample values in cells C15:C19.
Your Sample Mean and Sample Standard Deviation will be automatically calculated in C10 and C11. - Next, input your Nominal Value in cell B2, Lower Spec Limit in B3, and Upper Spec Limit in B4.
- Then, input your Measured Value in cell B5 and Std. Uncertainty in B6 - your different outputs will be automatically calculated:
- Lastly, choose the Decision Rule you would like to use in cell G1:
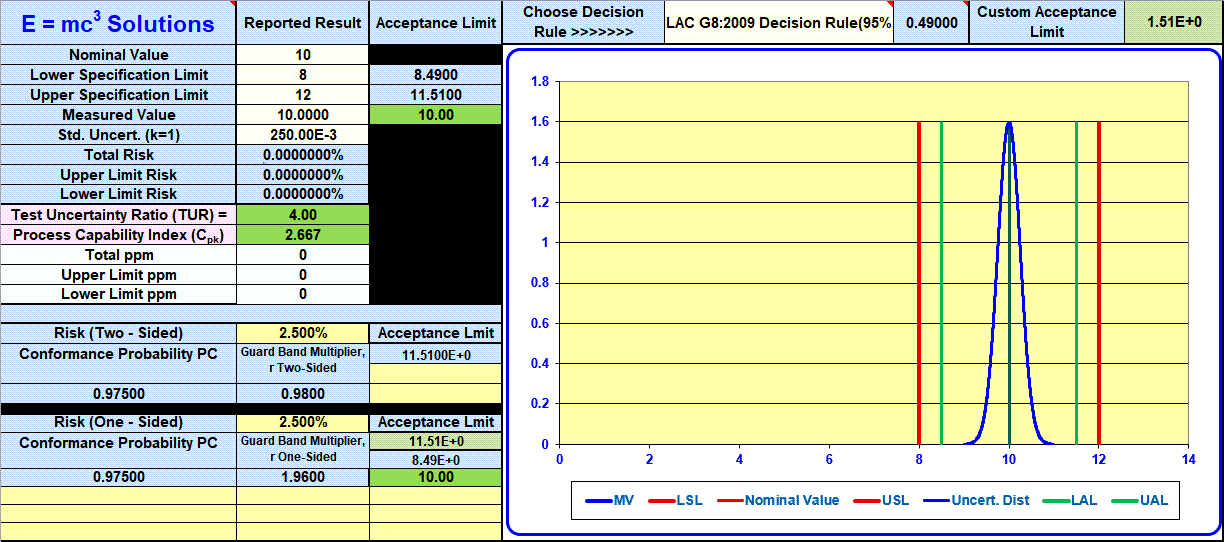
ILAC G8:2009 Decision Rule (95%)
ANSI Z540.3 Method 5 (95.45%)
ANSI Z540.3 Method 6
Simple Acceptance
RDS
Custom
NOTE: If your TUR in cell C10 is > = 4, the cell will turn Green, while if the value is < 4, the cell will turn Red.
If your Cpk in cell C11 is > = 1.33, the cell will turn Green, while if the value < 1.33, the cell will turn Red.
For additional questions regarding this template, contact E=mc3 Solution directly: 330-328-4400.
Uncertainty 2016
To complete this worksheet:
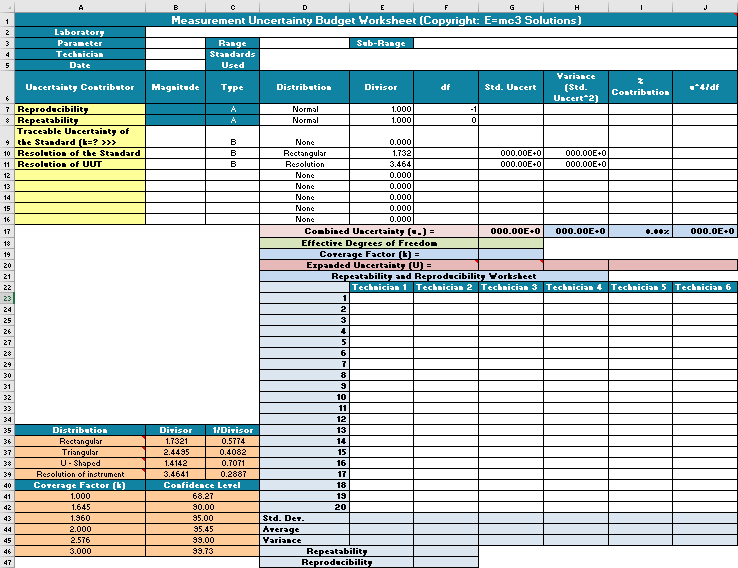
- Input your "Technicians" data in cells E23 to J42.
- Once you have done so, your Uncertainty values will be calculated and filled in automatically.
Repeatability in B7 and Reproducibility in B8
Combined and Expanded Uncertainty in G17 and G20 - You can change your "Distribution" definition in cells D7 through D16.
- Input "Traceable Uncertainty of the Standard" in cell B9, "Resolution of the Standard" in B10 and "Resolution of UUT" in B11. Lastly, input your Type in column C and Distribution definition in column D:
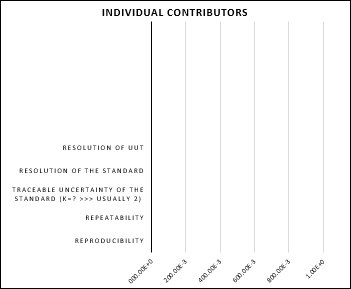
- Your data set will be placed into the following bar chart:
For additional questions regarding this template, contact E=mc3 Solution directly: 330-328-4400.
Uncertainty 2015
To complete this worksheet:
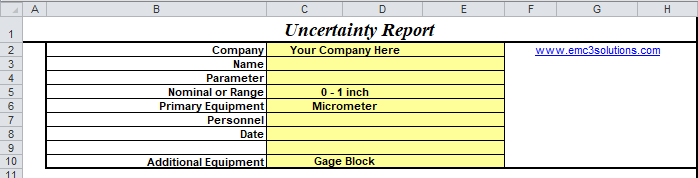
- Input your information into cells C2 through C10.
- Next, input your measurements data in I14 through R18.

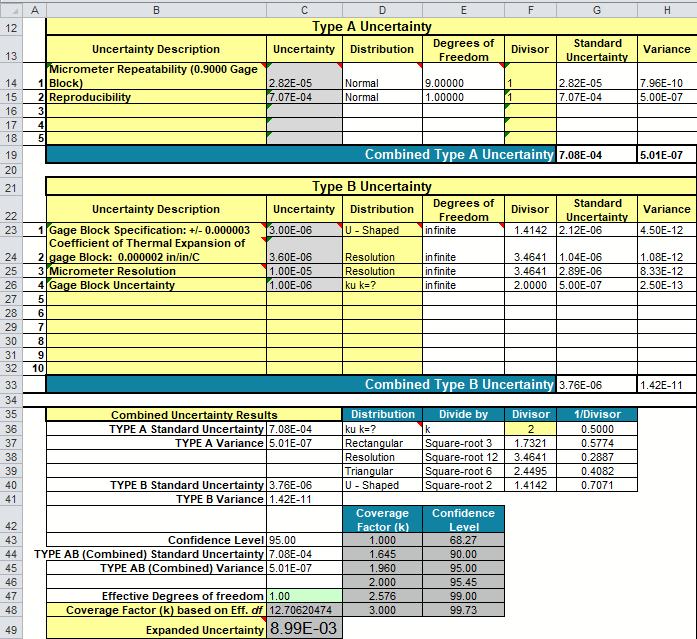
- Once you have done so, your Combined Type A and B Uncertainty values will be calculated and filled in automatically:
(Combined Type A Uncertainty in G19)
(Combined Type B Uncertainty in G33) - Your data set will be placed into the following column charts:
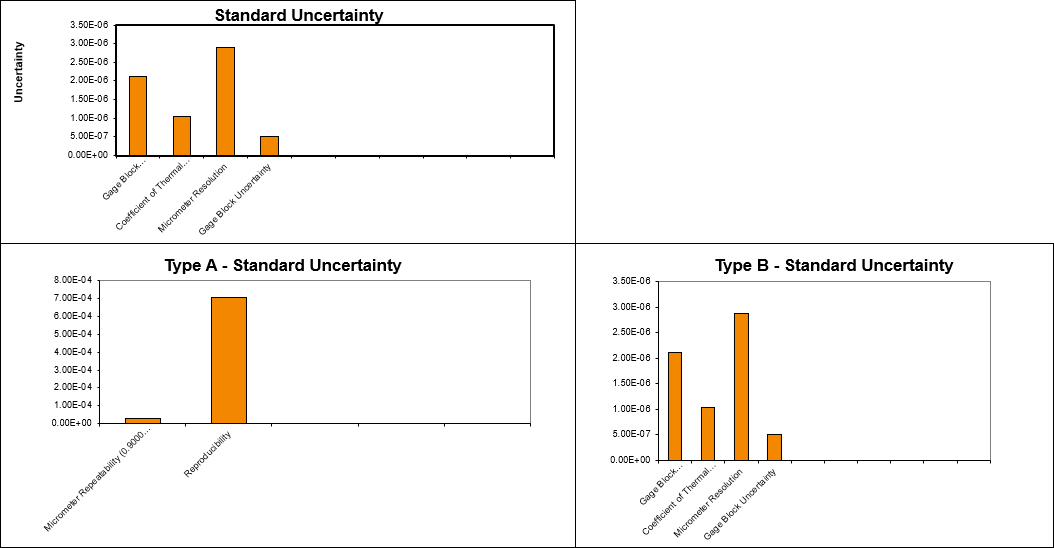
For additional questions regarding this template, contact E=mc3 Solution directly: 330-328-4400.
Other charts included in QI Macros add-in for Excel

Join 100,000+ Users
in 80 Countries