Need to Create a Spaghetti Diagram?
QI Macros has a Ready-Made Spaghetti Diagram Template for Excel!
Why it Matters:
Use a Spaghetti Diagram to define the existing flow as a starting point for removing unnecessary movement of people and materials through a workspace.
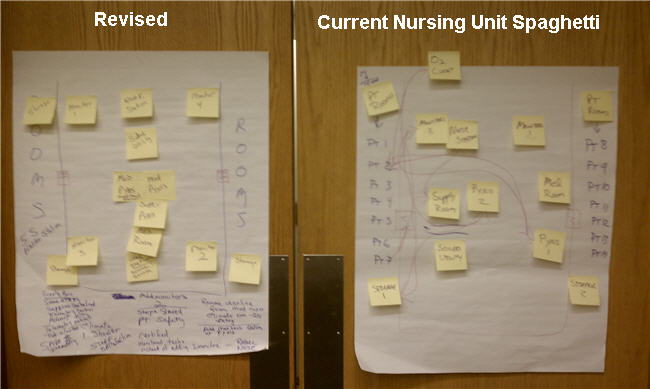
Below are spaghetti diagrams that show before and after lean process improvement changes that saved 50% of nurse travel time. This lean analysis took about an hour.
Example of a Nursing Unit Spaghetti Diagram for Travel Time
To Create a Spaghetti Diagram:
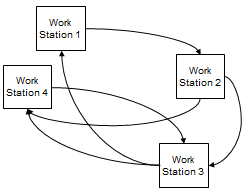
- Start with high level process steps. Use Post-it Notes to diagram the work stations or machines used. Count how many times each machine or work station is used.
- Draw arrows to show the movement of a product through the workspace.
- How would you rearrange the machines or work areas to reduce movement of people and materials?
Watch Video of How to Create a Spaghetti Diagram (Click Here)
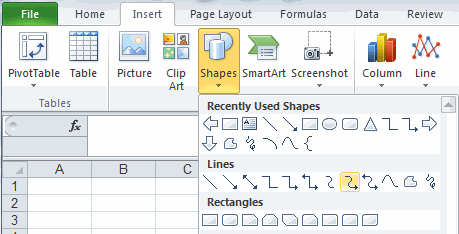
QI Macros Value Stream Mapping Template has a Spaghetti Diagram Template to help save you time. Just open the template and edit it using Excel's drawing tools. Use rectangles for workstations and curved arrows to connect the stations and show the flow.
Haven't you waited long enough?
Start creating your Spaghetti Diagram in just minutes.
Download a free 30-day trial. Get the Spaghetti Diagram now!
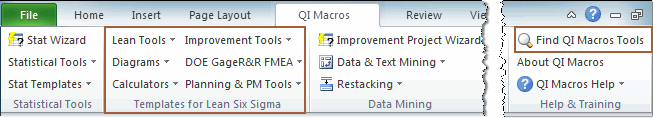
The Spaghetti Diagram is one of many tools included in QI Macros add-in for Excel.
QI Macros adds a new tab to Excel's menu, making it easy to find any tool you need. If you can't locate a tool, use the find tools feature on the far right side of QI Macros menu.