Want to Draw an Arrow Diagram in Excel?
QI Macros has a Ready-Made Arrow Diagram Template!
Arrow diagrams show the shortest path or time to complete a project
The arrow diagram is closely related to a CPM (critical path method) or PERT (program evaluation and review technique) diagram. It is also known as an activity network diagram. It can be used to plan the schedule for any series of tasks and to control their completion. The arrow diagram removes most of the complexity of CPM and PERT methods, and retains the flow from task to task and the timing required for each task. It does, however, require that you know what each task is and how long it takes. Without such knowledge, it¹s difficult to develop the arrow diagram.
How to Create an Arrow Diagram
- Brainstorm all of the tasks required to complete a given project, including the estimated time required for each task. Again, note cards are useful for this process.
- Sequence all of the cards from the start to finish, removing duplications, adding new ones as additional tasks are identified, and placing parallel activities where they belong.
- Reevaluate the shortest, longest, and average estimated times for each task and identify the longest path through the diagram.
- Use the arrow diagram to track progress of each activity throughout the project life cycle. Any time an element gets in jeopardy, it may need to be examined and necessary resources shifted to complete it.
Haven't you waited long enough?
Start creating your Arrow Diagram in just minutes.
Download a free 30-day trial. Get the Arrow Diagram now!
The Arrow Diagram is one of many tools included in QI Macros add-in for Excel.
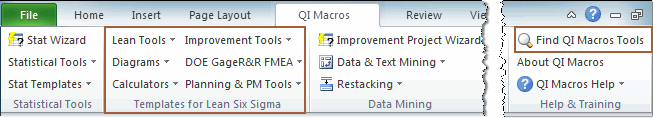
QI Macros adds a new tab to Excel's menu, making it easy to find any tool you need. If you can't locate a tool, use the find tools feature on the far right side of QI Macros menu.