DPMO Six Sigma Calculator in Excel
Calculate DPMO and Sigma using this template in QI Macros add-in
Instructions for Use
Input areas are shaded in yellow and represent the following:
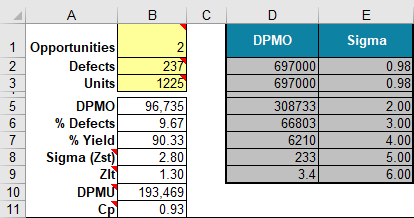
- Opportunities = the number of defects possible per unit
- Defects = # of defects
- Units = # of units in a sample
When you input these three items, the template performs the calculations and displays these metrics in cells B5:11:
- DPMO: defects per million opportunities
- % defects: percent of total opportunities that were defective
- % yield: percent that is not defective (1-% defects)
- Sigma: sigma level associated the the calculated DPMO (see reference table in columns D1:E9.)
- Zst: Z short term
- DPMU: defects per million units
- Cp: process capability metric = Sigma/3
Further definitions:
Defects and units are fairly straightforward but some folks struggle with the number of opportunities. The number of opportunities is based on how you choose to count defects. Here are some examples:
- One opportunity: an item is either wrong or right, good or bad.
- Two opportunities: A package could have the wrong product or the wrong # products in it.
- Example of three opportunities: a shirt you order could be the wrong: size, style or color.
QI Macros DPMO Six Sigma Calculator Template
The DPMO template is one of many tools in QI Macros add-in for Excel. QI Macros installs a new menu on your Excel tool-bar. To access the DPMO calculator, just click on QI Macros, then Calculators, and then "DPMO | Yield | Cp/PPM | OEE":
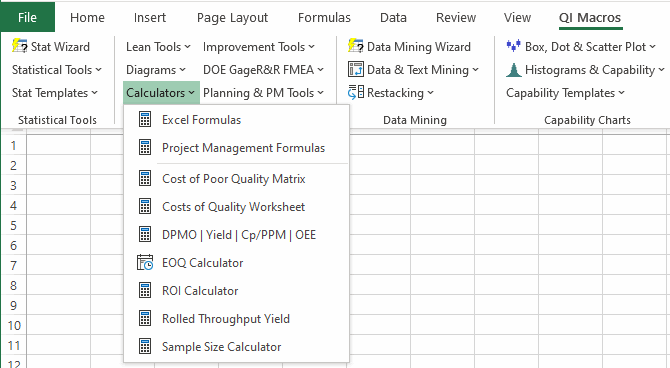
A template will open with the following worksheet tabs:

Watch Video on the DPMO, Six Sigma and RTY Calculators
Learn More...
- Rolled Throughput Yield template for more than one process step.
- Cp Cpk Cpm calculator
- Taguchi loss function
