Want to Draw a Taguchi Loss Function Curve in Excel?
QI Macros has a Ready-Made Taguchi Loss Function Template!
Why it Matters
The Taguchi loss function is concept that graphically demonstrates the impact of deviating from a target value. It is based on the premise that as measurements move further from the target, costs and customer dissatisfaction increase exponentially.
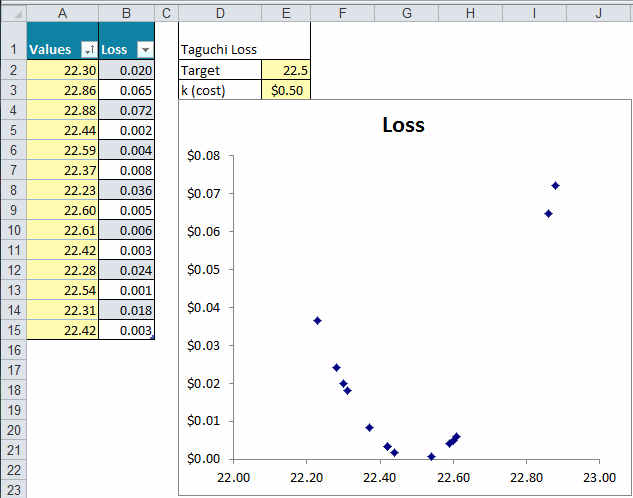
Example of the QI Macros Taguchi Loss Function Template.
To Calculate Taguchi Loss Function Using QI Macros Template:
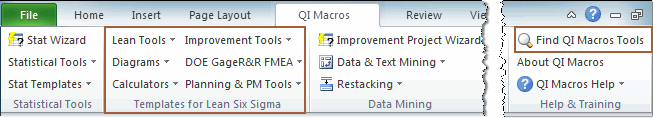
Click on QI Macros, then Calculators, then "DPMO | Yield | Cp/PPM | OEE" to open the template. The template has several worksheets including one for Taguchi Loss.
![]()
- Input your data into column A.
- Input the target value for the data into cell E2.
- Input the cost as the data moves away from the target in cell E3.
That's it. The template makes the calculations and draws the chart for you.
Haven't you waited long enough?
Start creating your Taguchi Loss Function Tool in just minutes.
Download a free 30-day trial. Get the Taguchi Loss Function Tool now!
The Taguchi Loss Function Tool is one of many tools included in QI Macros add-in for Excel.
QI Macros adds a new tab to Excel's menu, making it easy to find any tool you need. If you can't locate a tool, use the find tools feature on the far right side of QI Macros menu.