Looking for a Gantt Chart Template in Excel?
QI Macros has Two Ready-Made Gantt Chart Templates!
What is a Gantt Chart? Gantt charts are a valuable project planning tool that visually show the timing and length of project tasks using bars.
QI Macros Gantt chart template is compatible with both PC and Mac.
How to create a Gantt chart using QI Macros template
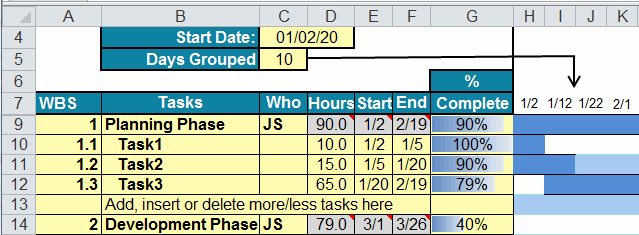
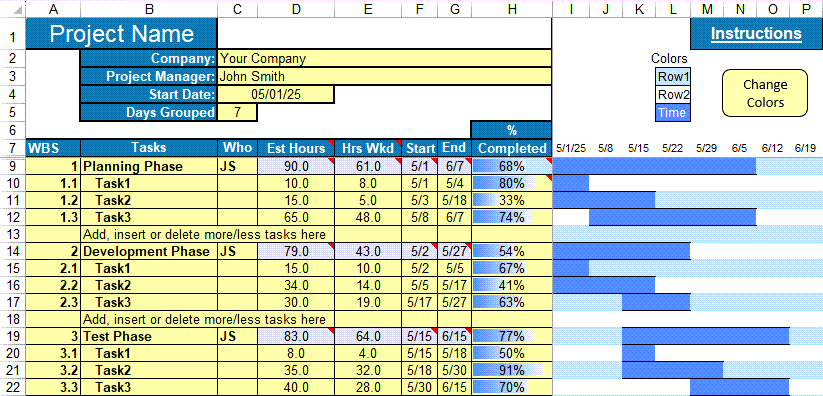
- Input the start date in cell C4.
- Input the "Days Grouped" in C5. Days grouped defines the # of days represented by each column.
- Identify major project phases.
- Identify the tasks under each phase.
- For each task, input the estimated number of hours required, along with the current hours worked, and the start and end dates.
You can type values into the cells or save time by using some of the template's built-in formulas.- Task 1: Input the start date. There are two ways to input end dates:
- Update the existing formula in the cell which equals the start date plus a # of days (i.e. E12 + 3)
- Type a date over the formula
- Subsequent Tasks: Start date is set to equal the end date for the previous task. This formula can be overridden by inputting a date into the cell.
- Task 1: Input the start date. There are two ways to input end dates:
- For each phase, the values are calculated from the tasks. These can be overridden if desired.
- Input the % complete. The template will shade part of the cell to indicate the %.
To expand the Gantt Chart Template:
- Add tasks: select the row labeled "Add, insert, or delete more tasks he re" then insert a row. This will properly update the summary formulas for the phase.
- Add phases: just type into the cells below the example.
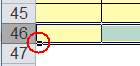
- Add rows to the bottom of the table: select the last row, then select and drag down the black box that appears.
To update the color bars found in columns H:IU:
- Change the "Fill" colors in cells K3:K5.
- Once you have done so, press the "Change Colors" button - this will update the color in each row accordingly.
NOTE: This functionality was included in the 01.2025 version of QI Macros.
How to use QI Macros Percent Complete Gantt Chart Template
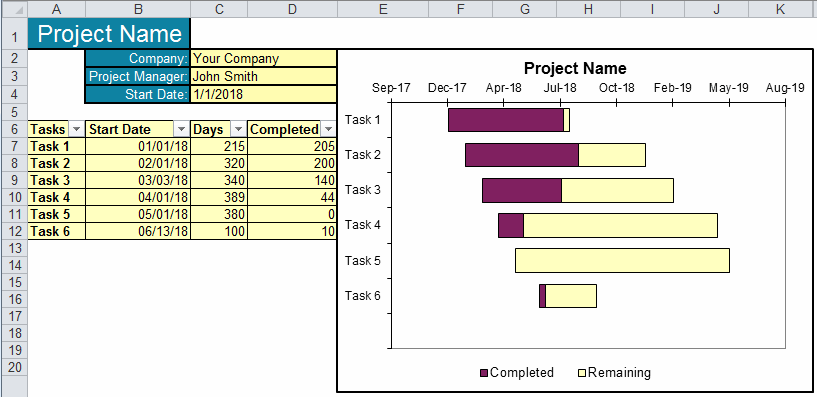
Follow the instructions below to begin filling in your Gantt Percent template:
- Input your Company Name in cell C2.
- Next, Input your Project Manager's name in cell C3 and the Start Date in cell C4.
NOTE: By inputting your Start Date in cell C4, the X-Axis in your Gantt Percent Chart will automatically update, as will cell B7. - Now, input the rest of your data in cells A7 through D12, and update the rest of your "Start Dates" in cells B8:B12. The "percent completed" bars will be automatically drawn!
Also, if you would like to change the dates in your X-Axis, follow these steps:
- Right-click on the X-Axis and select "Format Axis."
- Next, go to "Axis Options," and in the "Bounds" Minimum and Maximum, simply type in the date ranges you would like the Axis to begin and end at!

NOTE: If you would like to update the intervals between your dates, change the "Units" Major value in your Axis Options to the number of days between tick marks.
(e.g., A "Units" Major value of (90) will update the axis intervals to show every (3) months).

Learn More ...
Use Conditional Formatting to change the color of the bars on a Gantt Chart.
Haven't you waited long enough?
Start creating your Gantt Chart in just minutes.
Download a free 30-day trial. Get the Gantt Chart now!
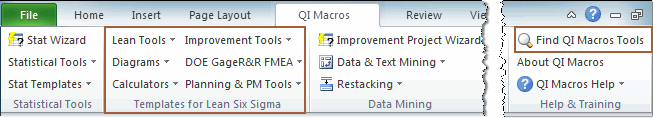
The Gantt Chart is one of many tools included in QI Macros add-in for Excel.
QI Macros adds a new tab to Excel's menu, making it easy to find any tool you need. If you can't locate a tool, use the find tools feature on the far right side of QI Macros menu.