Need to Create a Yamazumi Chart in Excel?
QI Macros has a Ready-Made Yamazumi Chart Template!
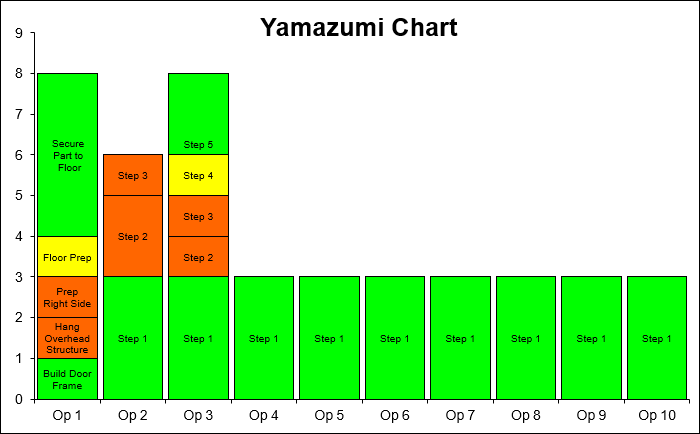
Why it Matters: Use the Yamazumi Chart to show cycle time (Takt time) for each step an operator performs and the balance between various operators.
Example of QI Macros Yamazumi Chart
To use the Yamazumi Chart Template in the QI Macros:
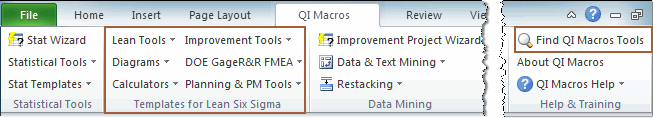
Click on the QI Macros menu then Lean Tools, then Yamazumi Chart. You have a choice between templates with 10 and 15 operators.
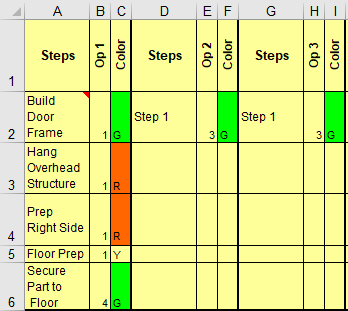
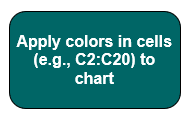
Input step names, cycle times, and color codes for each step to create the Yamazumi chart. Click on the apply colors button to update colors in the chart.
Thats it. It's that simple.
Other Popular Lean Tools in the QI Macros
Haven't you waited long enough?
Start creating your Yamazumi Chart in just minutes.
Download a free 30-day trial. Get the Yamazumi Chart now!
The Yamazumi Chart is one of many tools included in QI Macros add-in for Excel.
QI Macros adds a new tab to Excel's menu, making it easy to find any tool you need. If you can't locate a tool, use the find tools feature on the far right side of QI Macros menu.