Want a Cause-Effect Matrix for Excel?
QI Macros has a Ready-Made Cause-Effect Excel Template!
Why It Matters: The fishbone or Ishikawa diagram is one way to show cause-effects (a.k.a., root cause analysis-RCA). Another method uses a cause-effect matrix.
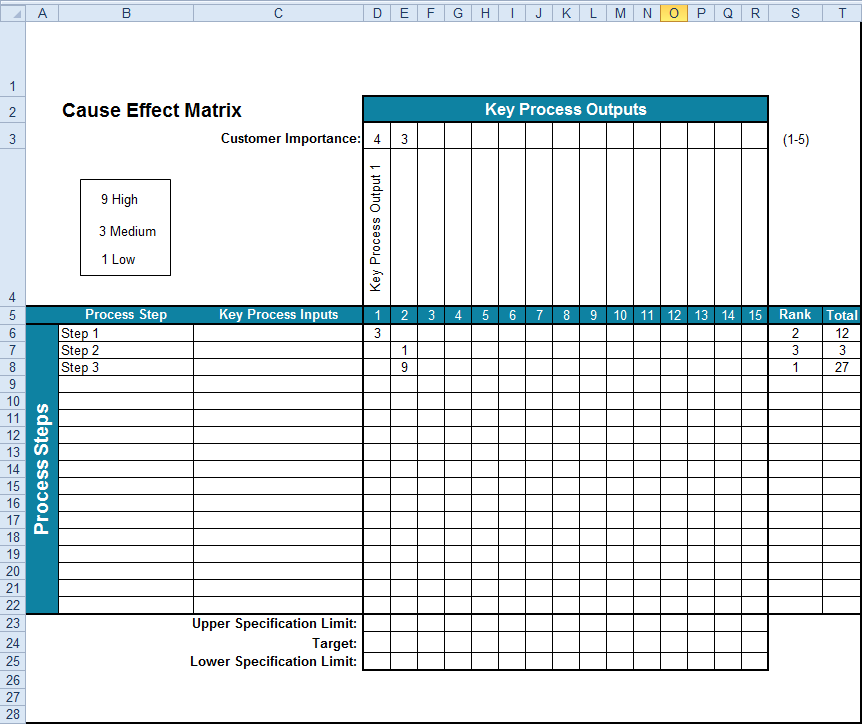
Example of a QI Macros Cause-Effect Matrix
How to Conduct a Cause-Effect Analysis
- Identify the key process outputs, requirements or effects. These are also known as critical to quality (CTQs).
Optional: Add Upper and Lower Specification Limits (USL/LSL) and target to each output. - Use a weighting factor (e.g., 1-5) to identify the importance of each output to the customer.
- For each process step, identify the key process inputs (i.e., causes).
- Then use a weighting factor (e.g., 1-low, 3-medium, 9-high) to show the impact or correlation of the input (cause) on each output (effect).
- The resulting total impact will be shown in the far right column and the ranking/priority of each input.
Haven't you waited long enough?
Start creating your Cause-Effect Matrix in just minutes.
Download a free 30-day trial. Get the Cause-Effect Matrix now!
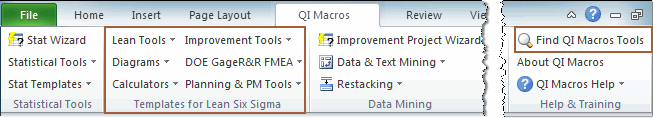
The Cause-Effect Matrix is one of many tools included in QI Macros add-in for Excel.
QI Macros adds a new tab to Excel's menu, making it easy to find any tool you need. If you can't locate a tool, use the find tools feature on the far right side of QI Macros menu.